> For the complete documentation index, see [llms.txt](https://docs.gaiodataos.com/llms.txt). Markdown versions of documentation pages are available by appending `.md` to page URLs; this page is available as [Markdown](https://docs.gaiodataos.com/use-cases/e-commerce-e-social-commerce.md).
# E-commerce e Social Commerce
### Project Overview
This project demonstrates how to use **Gaio DataOS** to build a complete analytical solution for **E-commerce and Social Commerce**, covering everything from **data extraction** to **predictive modeling** and **interactive dashboards**.
***
## Development Steps
### 1. Data Extraction
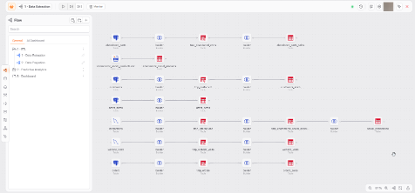
* Connect multiple data sources: PostgreSQL, MySQL, and CSV files.
* Use **ETL blocks** in Gaio to:
* Clean and transform data
* Create relationships across tables
* Store intermediate data in temporary tables like:
* `tmp_orders`, `tmp_customers`
* Create final analytical tables:
* `customers_sales`
* `orders_sales`
* `abandoned_carts_sales`
* `social_interactions`
***
### 2. Data Preparation
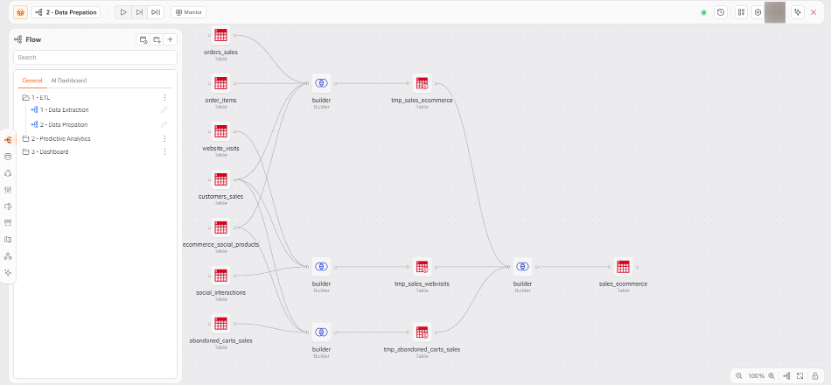
* Build a **unified flat table** named `sales_ecommerce` that combines:
* Sales, visits, customer profile, social engagement, and abandoned cart data
* This table is optimized for dashboards, exploration, and machine learning.
***
### 3. Predictive Analytics
#### **3.1 Churn Prediction**
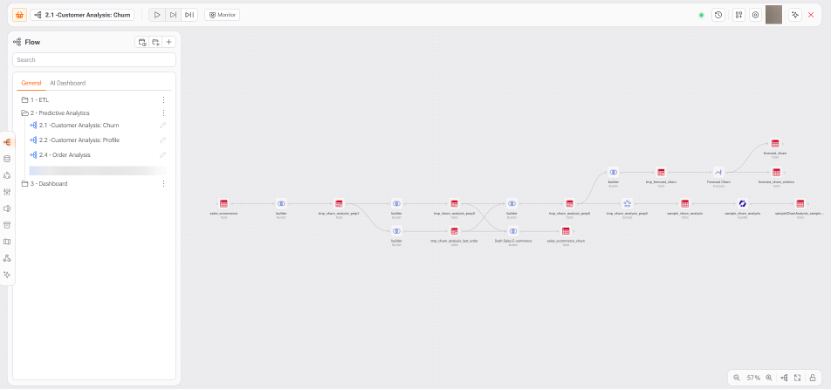
* Use the `sales_ecommerce` table.
* Engineer features like: last purchase, frequency, engagement.
* Use AutoML to predict churn probability.
* Output tables:
* `forecast_churn`: churn score per customer
* `forecast_churn_metrics`: model performance (ROC, accuracy, etc.)
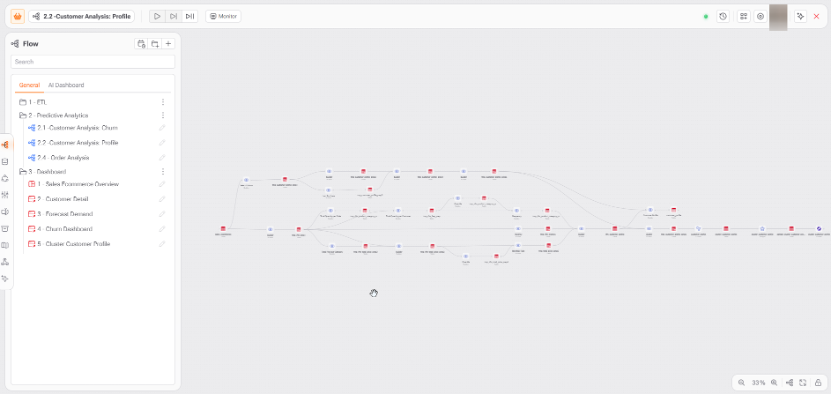
#### **3.2 Customer Profiling**
* Generate customer features: RFM, purchase gaps, preferred categories.
* Apply AutoCluster (K-Means) for customer segmentation.
* Interpret clusters based on behavior and buying patterns.
#### **3.3 Demand Forecasting**
* Aggregate order data by time, category, and channel into `tmp_order_demand`.
* Apply time series models using the Forecast module.
* Output tables:
* `forecast_order_demand`
* `forecast_order_demand_metrics`
***
### 4. Interactive Dashboards
Use Gaio’s visual dashboard builder to create:
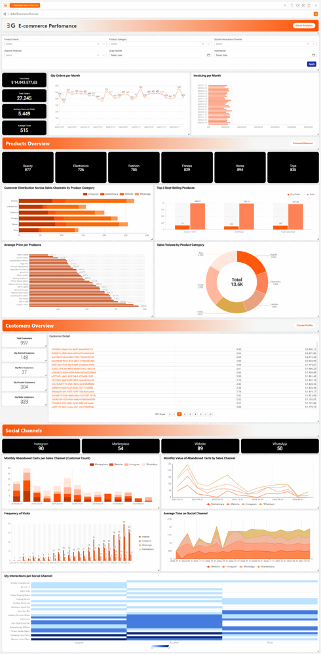
* **Sales Ecommerce Overview**:
* Total sales, channels, abandoned carts, social engagement.
* **Customer Detail View**:
* Individual customer metrics and lifecycle behavior.
* **Forecast Demand Panel**:
* Projected sales by time, product category, and channel.
* **Churn Monitoring**:
* Identify and track at-risk customers.
* **Customer Clustering**:
* Visualize segmented profiles for marketing and personalization.
***
### Technologies Used
* **Visual ETL workflows** in Gaio DataOS
* **Temporary and Final Tables** for data versioning
* **AutoML and Clustering** with assisted interface
* **Dynamic Dashboards** with filters, graphs, and tables
* **Discovery Module** for AI-generated insights (recommended)
***
### Expected Outcomes
* Reduced time for building analytical workflows
* Centralized multi-source data in a single platform
* Actionable predictions for churn and demand planning
* End-to-end visibility across ecommerce performance
***
### Download this project
{% file src="/files/2AriijVg8OUV8pcSyzjJ" %}
{% file src="/files/xbgTVkGtVfMOg7Xurw6C" %}