> For the complete documentation index, see [llms.txt](https://docs.gaiodataos.com/llms.txt). Markdown versions of documentation pages are available by appending `.md` to page URLs; this page is available as [Markdown](https://docs.gaiodataos.com/tools/tasks/analytics/scoring.md).
# Scoring
This task is task dependent AutoML. To use it, you must have previously created at least one model using AutoML.
Its usefulness is to apply the model to a new set of data. As an example, a company needs to charge its customers. To do this, she built a predictive model (AutoML) using her billing history, as she knows who paid and who didn't pay.
Now the company received a portfolio of customers at the beginning of the month to charge and wants to **apply** the model it had created to know who will pay and who will not pay. In addition to having this marking, she also wants to know the probability (0 to 1 or 0% to 100%) for each customer.
***
## How to Use the Scoring
***
### Access the "Scoring" Task
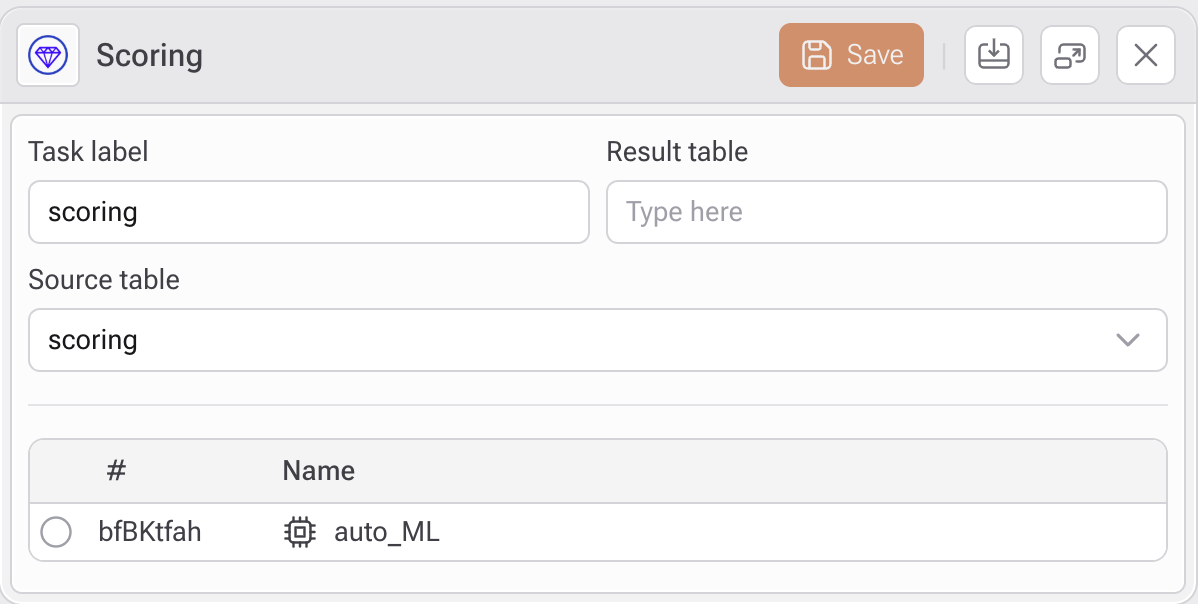
In the left-side menu under the **Analytics** section, click on **Scoring**.
***
### Set Up the Parameters
Fill in the following fields:
* **Task label**: (optional) Give a name to your scoring task (e.g., `scoring`).
* **Result table**: Define the name of the output table where the scored results will be saved.
* **Source table**: The table should be automatically linked from your selected block.
{% hint style="info" %}
The table that contains the customer portfolio for billing must have exactly the same columns as those in the table used to create the model with AutoML. The only column it will not have is the response variable, which in practice is what we want to know now (which customer will pay or not). Therefore, in [AutoML ](https://app.gitbook.com/o/0AwHT1YPyV5KV6qHeJNz/s/-MPpFa6rq60XeC7QMDh7/documentacao-1/studio/tarefas/analytics/automl), it is important to only use variables that we will have later to apply **Scoring** . If the columns do not match, an **error will be returned** .
{% endhint %}
***
### Select the Trained Model
Below the configuration section, a list of available models will appear. Select the model you want to use (e.g., `auto_ML`).
***
### Save and Execute
Click the **Save** button in the top right corner to apply the model and generate the results in the defined table.
***
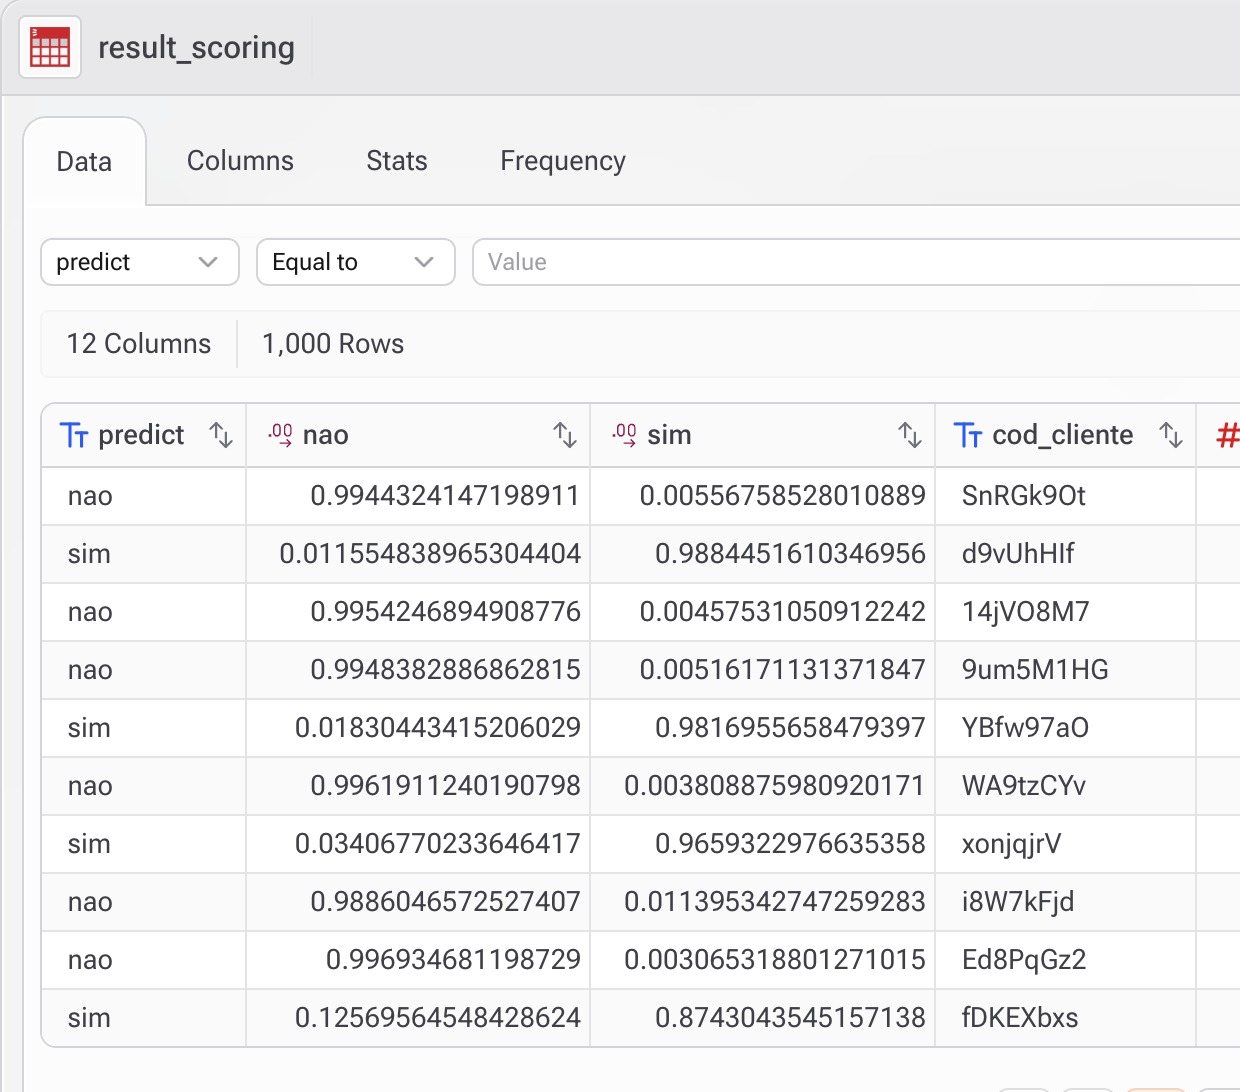
### Output
The resulting table will include:
* The original data from the source table.
* New columns containing the predicted scores or classifications.
* Additional probability or confidence metrics (depending on the model type).
#### Example
Below is an example for the case where the response variable is categorical and has two values ( **no** and **yes** ).
1. Forecast with two possible values for each customer.
2. Probability of **no.**
3. Probability of **yes.**
4. From that column cod\_cliente, all columns from the source table are repeated and are available for any analysis in the Gaio process.