> For the complete documentation index, see [llms.txt](https://docs.gaiodataos.com/llms.txt). Markdown versions of documentation pages are available by appending `.md` to page URLs; this page is available as [Markdown](https://docs.gaiodataos.com/tools/flow.md).
# Flow
**Flow** is the visual environment in Gaio Studio designed to **create data pipelines**. It allows you to connect tasks and transform data in a modular, agile, and collaborative way. It's ideal for ETL processes, automated analytics, machine learning, reports, and data delivery.
***
#### Purpose of the Flow
To build complete workflows by organizing data processing, analysis, and delivery steps in a connected, visual format.
***
## How to Use Flow
### **1. Access the Flow Section**
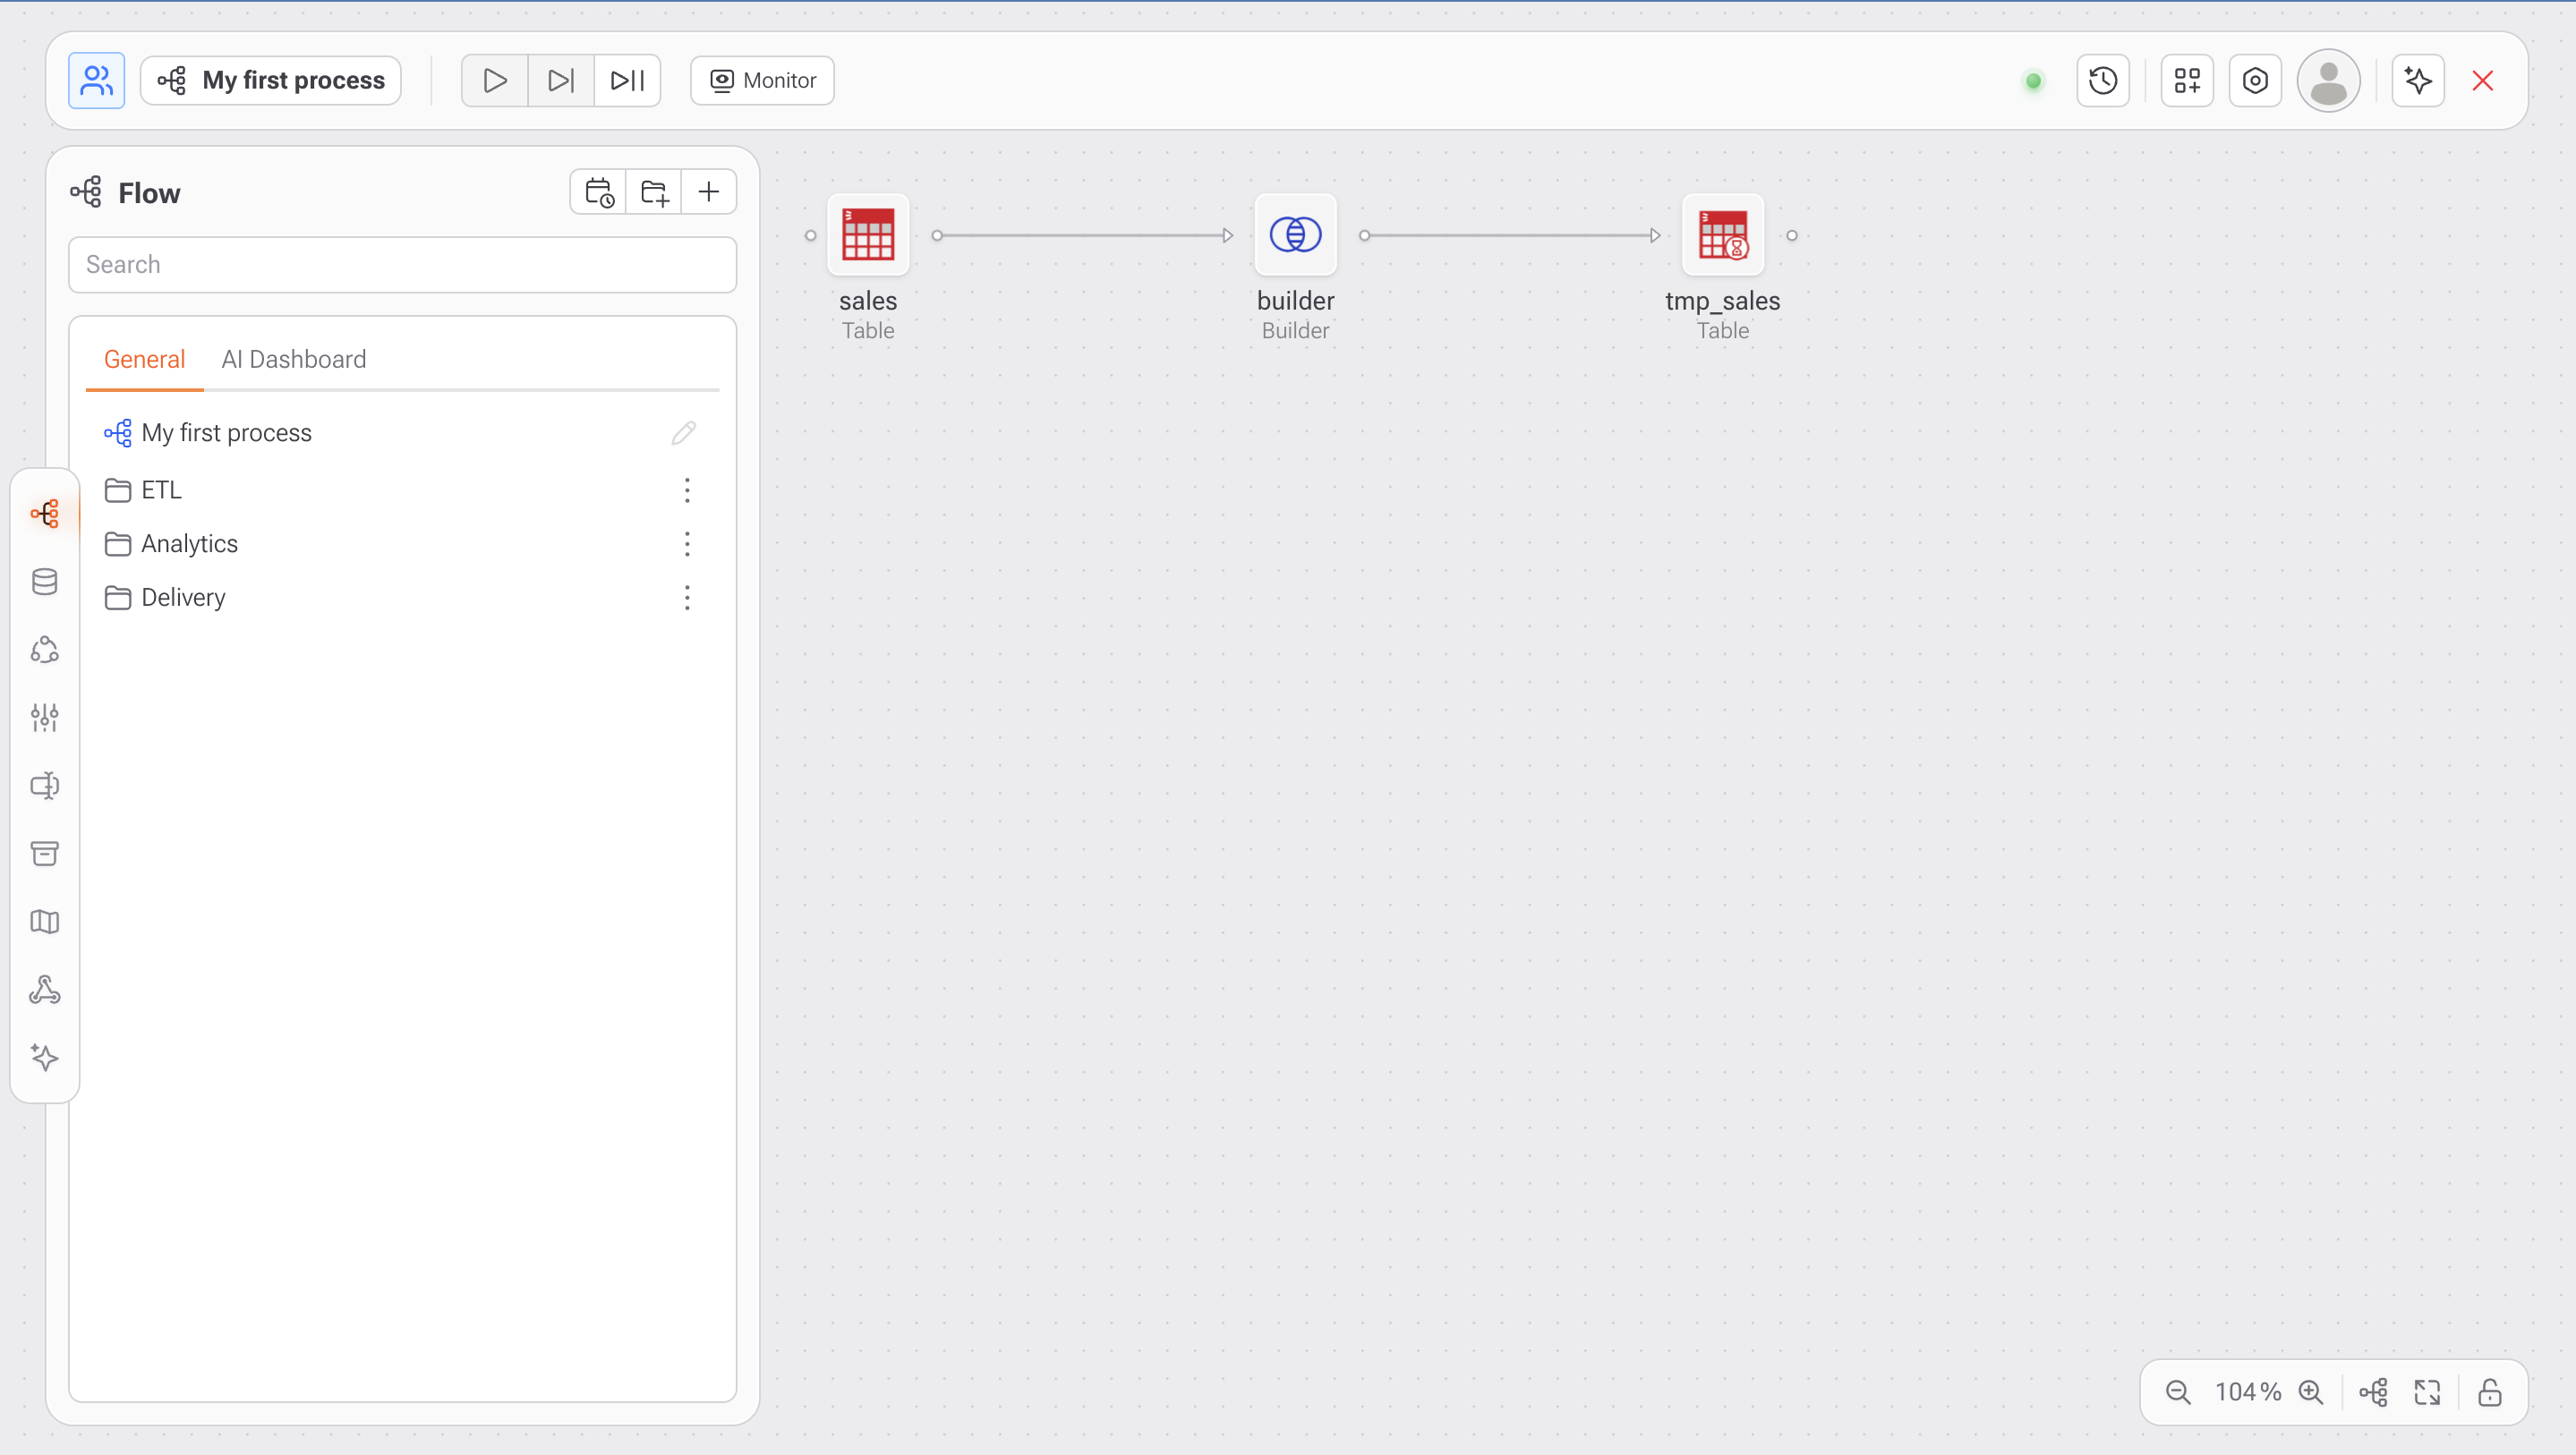
* Click the **Flow** icon on the left sidebar.
* You'll see the canvas with the name of the current process (e.g., *My first process*).
* The left panel displays folders for organization. Example: **ETL**, **Analytics**, and **Delivery**.
***
### **2. Create or Select a Process**
* Click the `+` button in the top corner of the panel to create a new process.
* Name the process and begin adding blocks as needed.
***
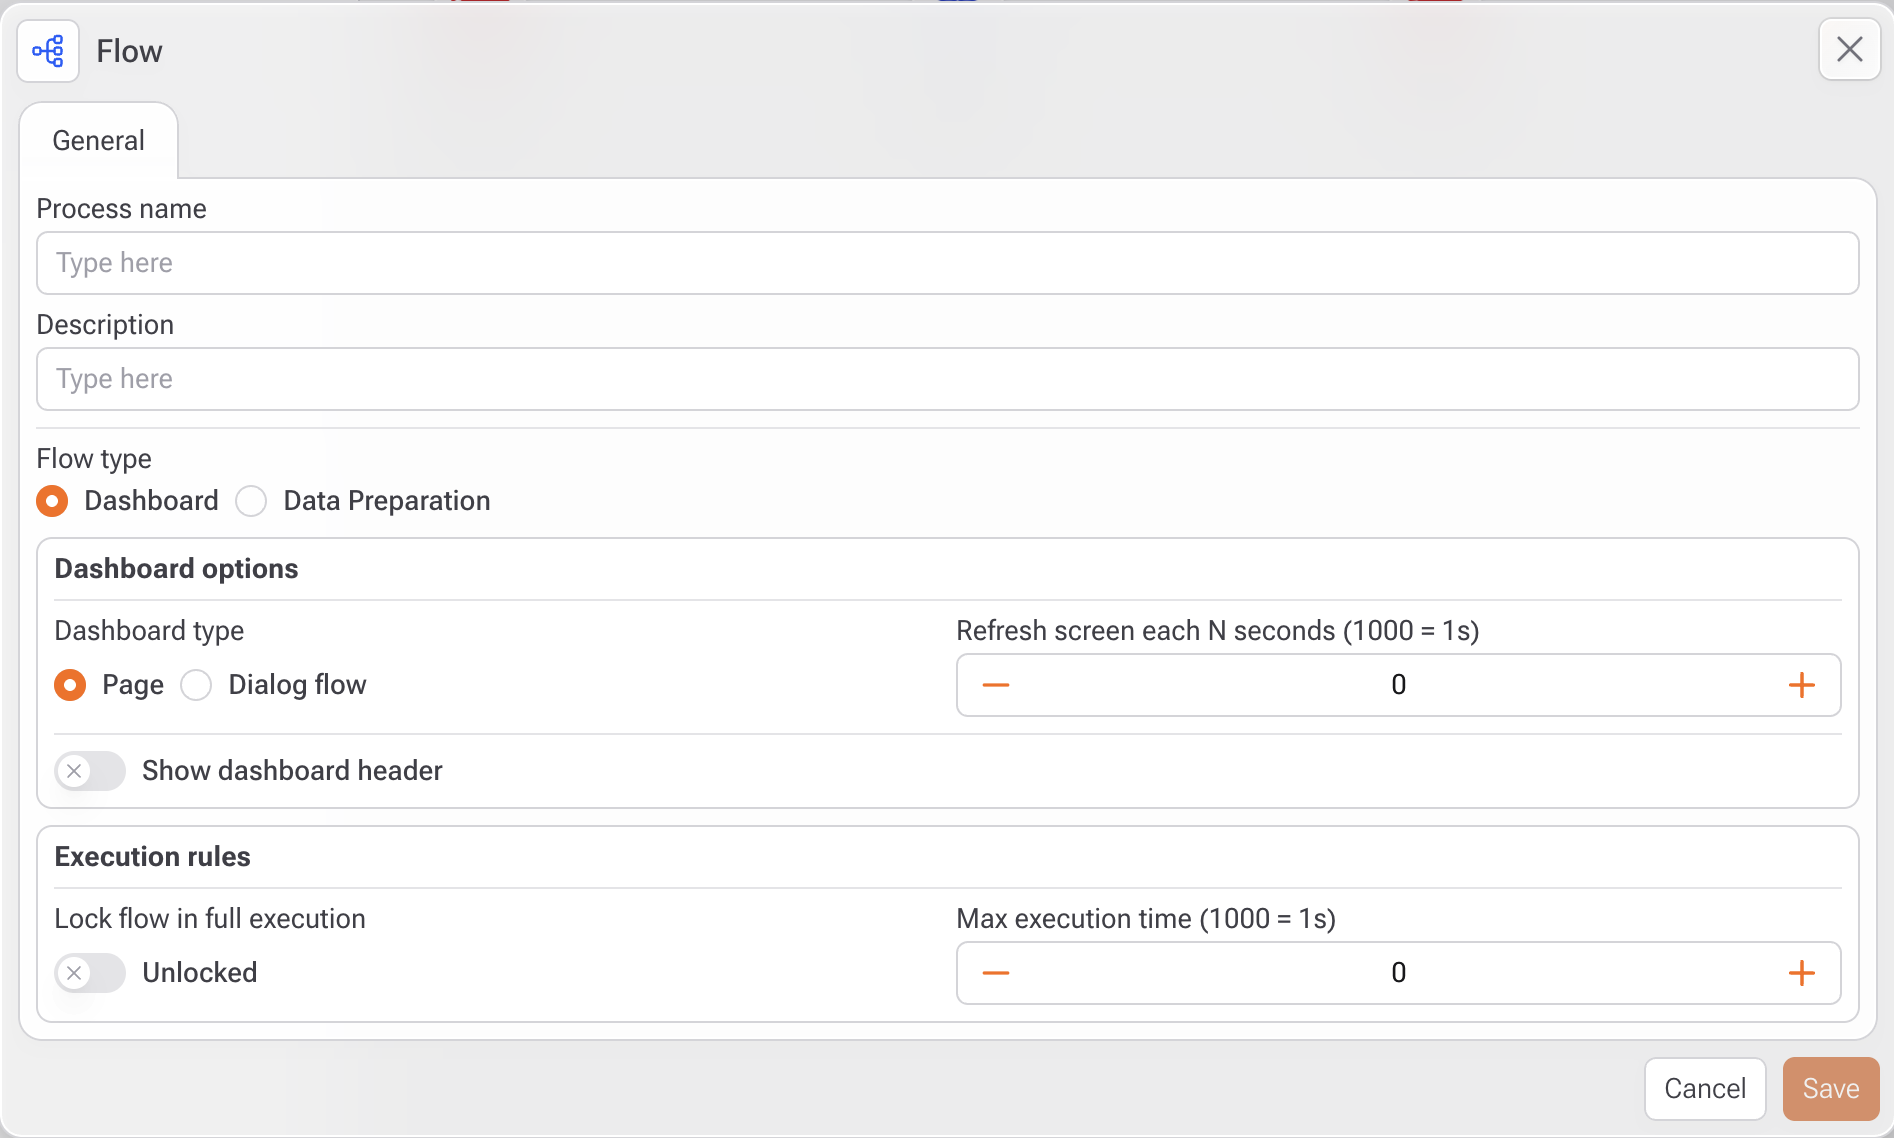
### 3. Step-by-Step: Flow Setup
1. **Process Name**
* Enter a clear and descriptive name for your process (e.g., `Sales_ETL_Flow` or `CustomerDashboard`).
* This name will appear in the Flow workspace and sidebar.
2. **Description**
* (Optional) Provide a brief summary of the flow’s purpose.
* Useful for documentation and collaboration across teams.
3. **Flow Type:**
* **Data Preparation**:
* Choose this option for backend flows focused on data transformation, loading, and modeling.
* **Dashboard**:
* Use this if your flow will generate a visual dashboard for monitoring or user interaction.
* Dashboard Options (If “Dashboard” is selected)
* **Dashboard Type**:
* **Page**: Displays the dashboard as a full page.
* **Dialog Flow**: Opens the dashboard inside a modal or dialog window.
* **Show Dashboard Header**:
* Enable or disable the header section of the dashboard.
* Useful to provide titles or filters for the user.
* **Refresh Screen Interval**:
* Set the screen auto-refresh interval (in milliseconds).
* Example: `1000` = 1 second; `60000` = 1 minute.
* Use this for real-time monitoring dashboards.
4. **Execution Rules**
* **Lock Flow During Execution**:
* **Max Execution Time**:
* Define the maximum runtime allowed for this flow (in milliseconds).
* Example: `300000` = 5 minutes.
* Helps avoid indefinite executions or overloading the server.
***
### **4. Drag and Connect Blocks**
* Drag tasks from the left menu (such as Table, Builder, Cluster, AutoML, etc.).
* Connect blocks by clicking the gray dot next to a block and dragging it to another.
***
### **5. Edit Each Block Individually**
* Click on the pencil icon any block to open its configuration window.
* Adjust table settings, SQL scripts, visualization parameters, or machine learning configurations.
***
### **6. Run the Process**
* Use the top bar buttons to:
* Run: Start selected task
* Run from here: Start running the flow from the selected task
* Run all: Run the entire flow
* Click **Monitor** to track logs and execution performance in real-time.
***
#### Best Practices
* Use clear and consistent naming for processes and tables (e.g., `tmp_sales_daily`).
* Keep your blocks organized visually on the canvas.
* Break large workflows into smaller thematic subflows.
* Add comments inside each block to document logic.