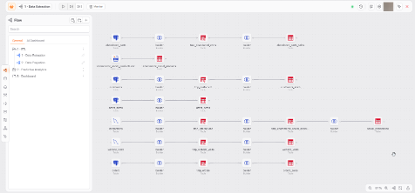
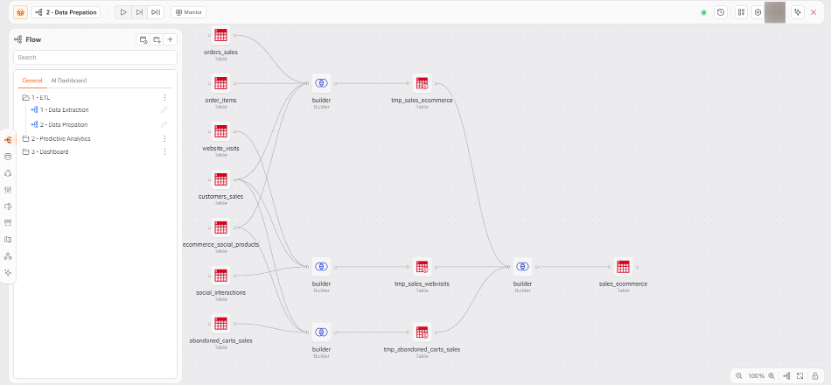
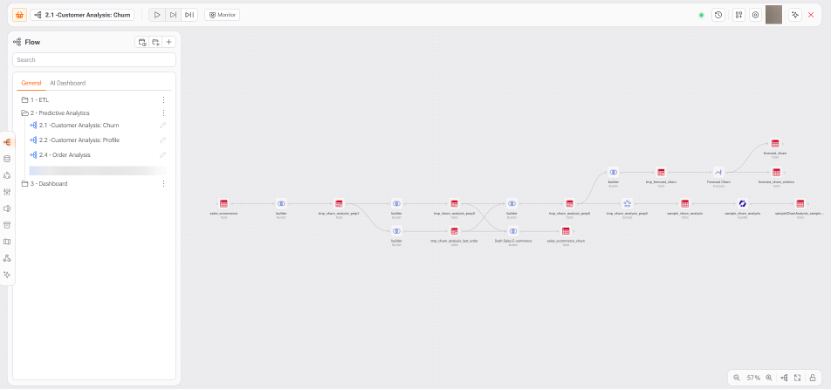
# Welcome to Gaio DataOS

### What is Gaio DataOS?

**Gaio DataOS** is a **Data Operating System** — a new category of platform designed to empower individuals and organizations to unlock the full potential of their data. While it's not an operating system in the traditional sense like Linux, Windows, or macOS, it behaves in a similar way: it orchestrates tools, resources, and interactions across a unified environment.

***

### &#x20;The Concept of a Data Operating System

A traditional operating system manages hardware and software, providing users with a consistent interface and core functions.\
**Gaio DataOS brings this same philosophy to the world of data.**

It acts as an **intelligent, all-in-one environment** where users can:

* Import and explore data
* Build advanced analytics
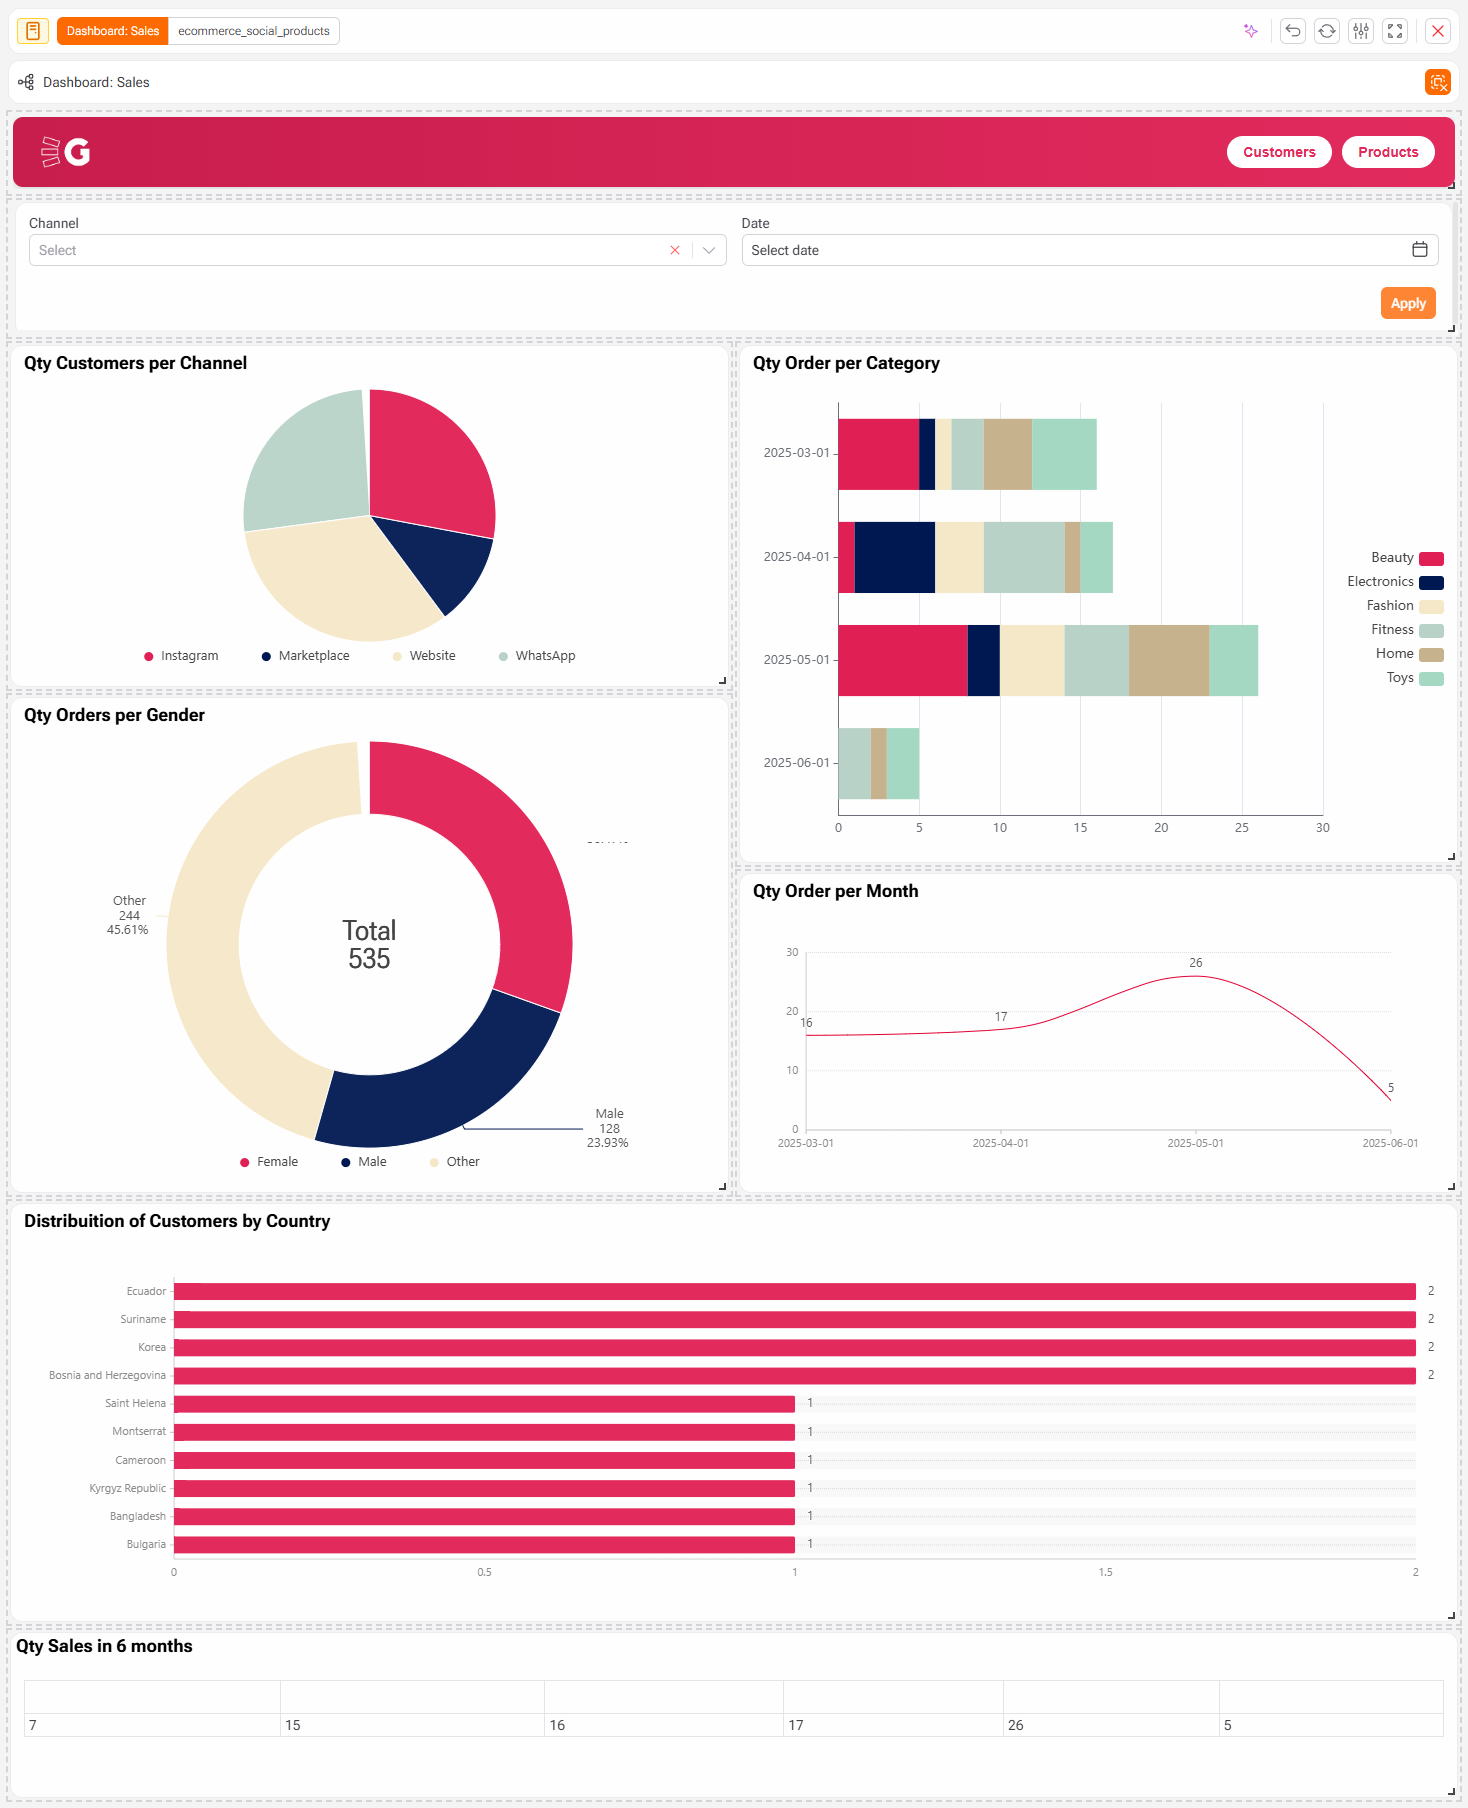
* Create dashboards and reports
* Train and deploy machine learning models
* Automate complex workflows
* Share insights through APIs or interfaces
* And much more — all from a unified platform

Whether you're a **data scientist**, **analyst**, **engineer**, or **business user**, Gaio gives you access to high-tech capabilities through an intuitive and collaborative interface.

<figure><img src="/files/yHJ7dNI6uZfNxTrBtNMR" alt=""><figcaption></figcaption></figure>

***

### For Technical and Non-Technical Users

One of the key innovations of Gaio DataOS is its **accessibility**:

* **Non-technical users** can interact with forms, build reports, explore data visually, and use AI-powered tools — no code required.
* **Technical users** can go deeper with SQL, Python, JavaScript, API integrations, and machine learning — building custom, scalable, and intelligent data solutions.

You don’t need to switch platforms or tools. Everything is already here — connected, governed, and optimized.

***

### Why It Matters

Data is no longer a back-office asset. It’s a **core strategic resource**.\
But too often, access to data tools is fragmented, slow, or restricted to experts.

**Gaio DataOS changes this.** It brings the power of a full-stack data platform into one coherent, flexible system — making **data-driven innovation available to everyone**.


# Gaio DataOS

## Accessing Gaio DataOS

This quick guide will show you how to access and start using Gaio DataOS safely and easily.

***

### 1. Getting started&#x20;

<figure><img src="/files/j8LElf4dXjUCyrYK1sHr" alt=""><figcaption></figcaption></figure>

First, visit the [Gaio website ](https://gaiodataos.com/)to begin your registration. Go to **Get Started** to choose your license. From there, you will be directed to the console page to enter your email address and begin your registration.

### Choosing a license

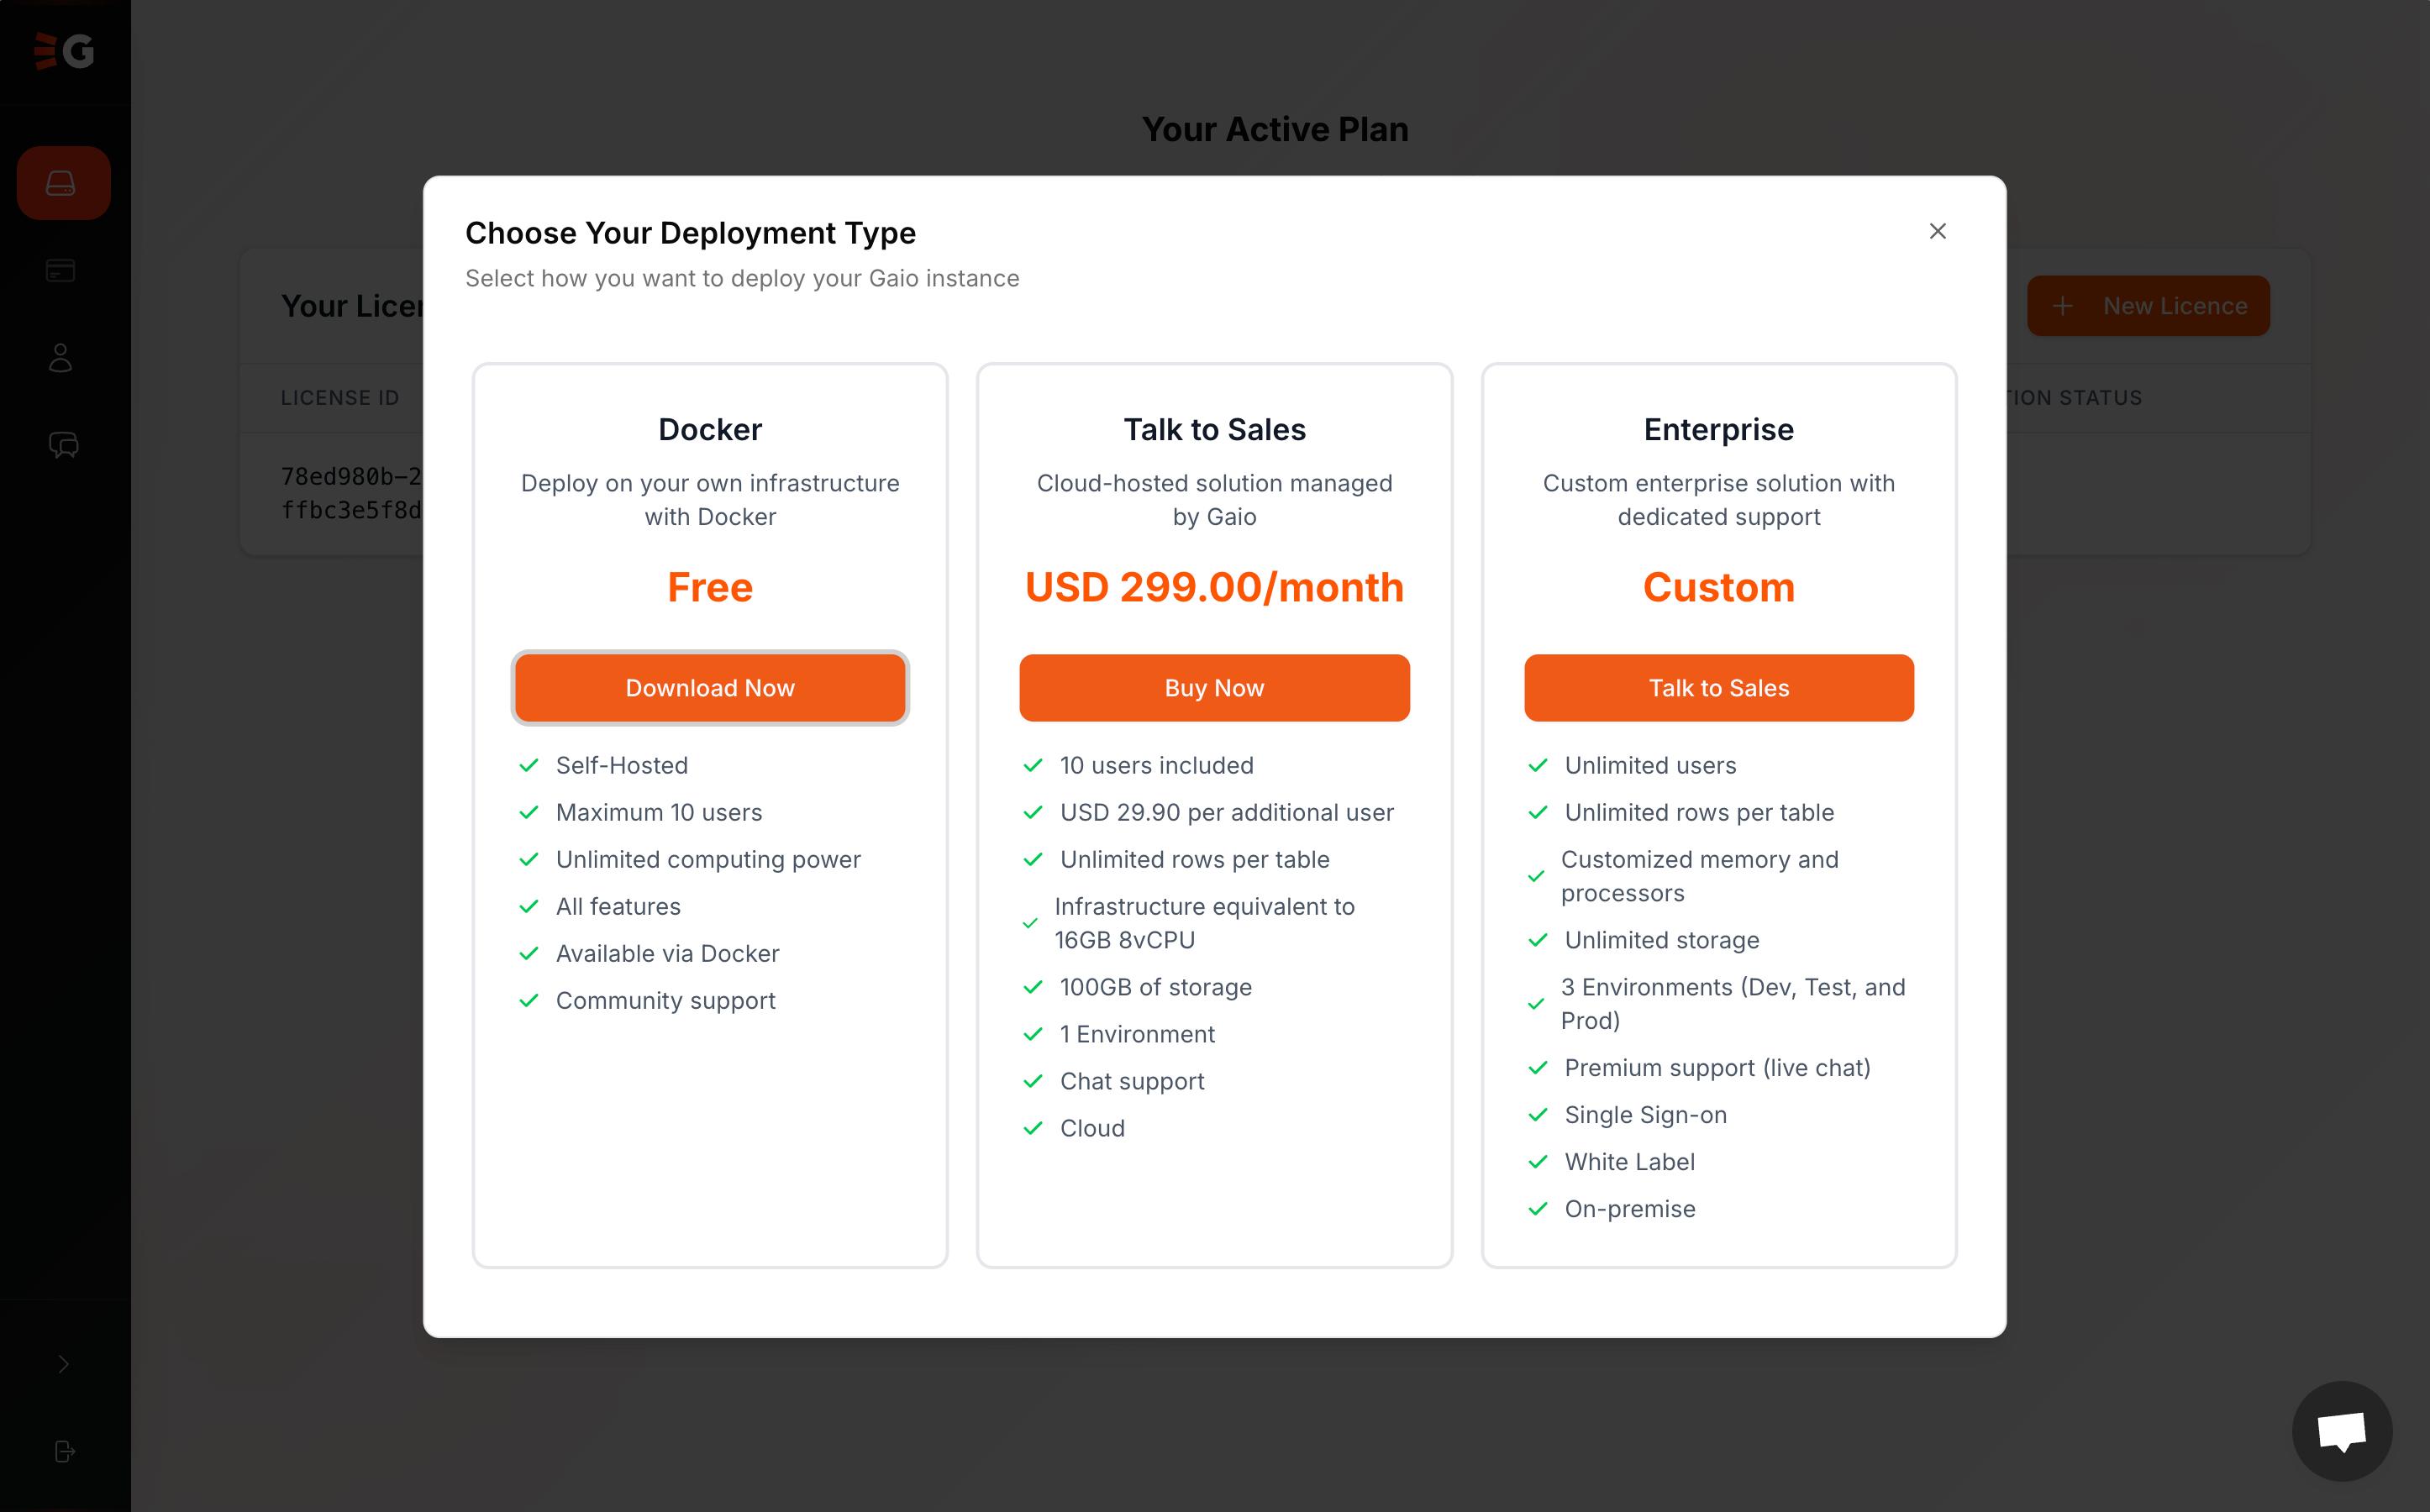
After registering, select the license in the **Instances tab**. For Cloud-Hosted solution or Enterprise licenses, you will be redirected to support and scheduling with the sales team.

<figure><img src="/files/DaKklZhMIfRQezyVm4FA" alt=""><figcaption></figcaption></figure>

{% hint style="info" %}
For information on how to use the Docker version, [click here](https://docs.gaiodataos.com/~/revisions/tTopPz3RC0MehJmvrNTp/getting-started/installation-with-docker).
{% endhint %}

***

### &#x20;2. Log in with your credentials

<figure><img src="/files/W3vX5uWjx8BKgtEepZo5" alt=""><figcaption></figcaption></figure>

Once your instance is open, use the login credentials provided:

* **Email:** `your-email@exemple.com`
* **Initial password:** (copy it using the icon next to the password field)

{% hint style="warning" %}
&#x20;When logging in for the first time, you will be prompted to create a new personal password. Make sure to store your credentials securely.
{% endhint %}

***

### 3. Instance information

In the instance control panel, you’ll find key details:

* **Active license:** `Gaio Free`
* **Start date:** `May 14, 2025`
* **Status:** `Ready`  (ready to use)

***

### 4. Create a new instance (optional)

If you want to start a new environment:

* Click the **`+ New Instance`** button at the top right of the screen.

***

### 5. Delete an instance (with caution!)

If you wish to remove the current instance:

* Click **`Delete`** (red button at the bottom right corner).

{% hint style="danger" %}
This action is permanent and cannot be undone. Make sure all important data is backed up or transferred before deleting.
{% endhint %}

***

### All set!

You’re now ready to explore the features of Gaio DataOS and start turning data into strategic decisions.

If you need help, contact our support team or continue browsing the next tutorials.


# Quickstart

## Login and First settings

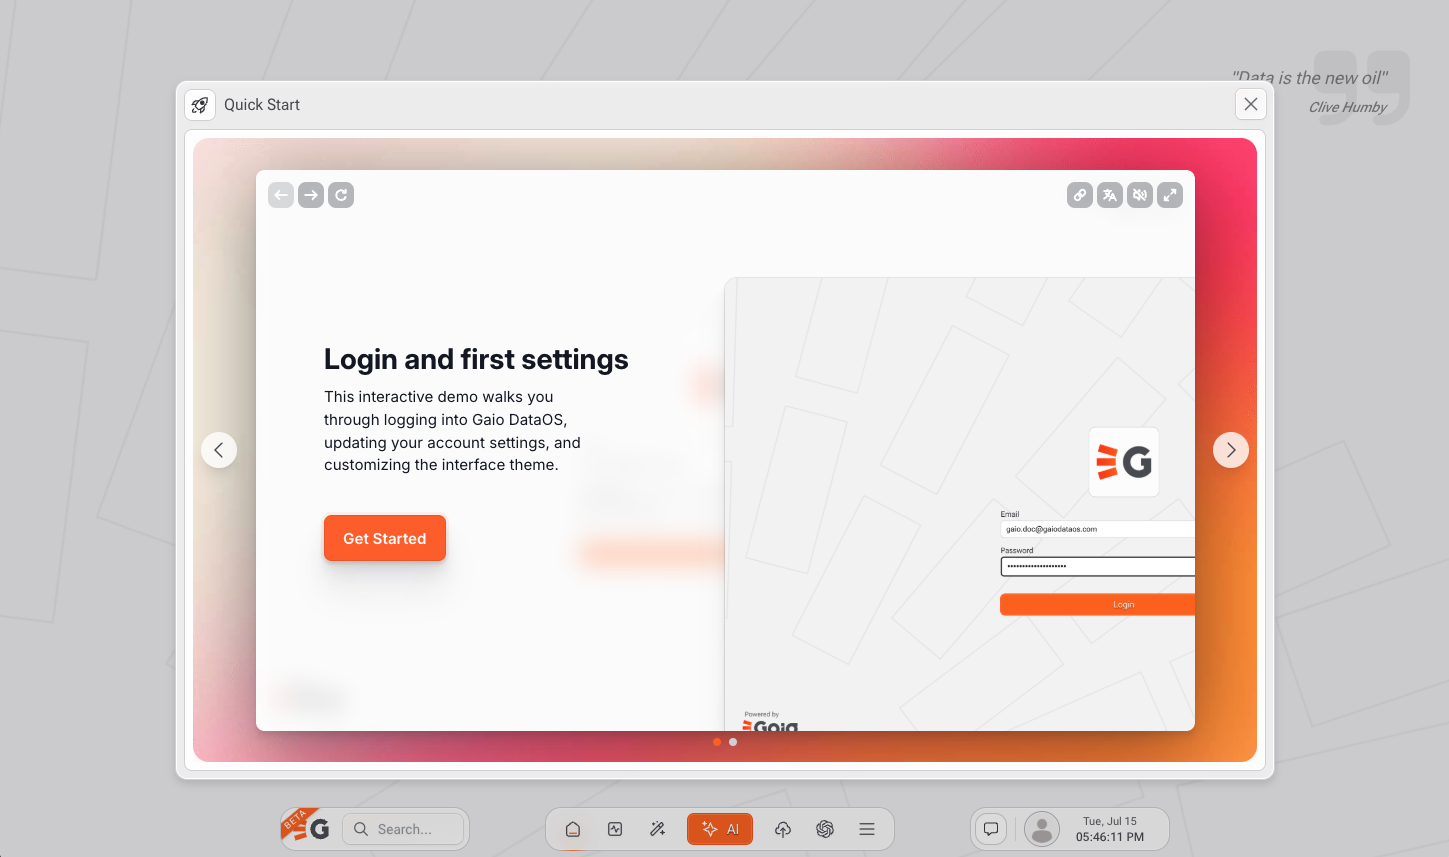
This interactive demo walks you through logging into Gaio DataOS, updating your account settings, and customizing the interface theme.

{% @arcade/embed flowId="VT10kUXIMRGJ6WQsdGeY" url="<https://app.arcade.software/share/VT10kUXIMRGJ6WQsdGeY>" %}

## Upload your data, search, and use AI to generate reports

This step-by-step guide demonstrates how to upload a CSV file, configure data columns and types, and perform basic data exploration and analysis within the application. Follow along to learn how to prepare your data for insights and interact with AI-powered analytics and chat features.

{% @arcade/embed flowId="7NiyvKCWgyViq4yBdlHZ" url="<https://app.arcade.software/share/7NiyvKCWgyViq4yBdlHZ>" %}


# Installation with Docker

Welcome to the **installation guide for the Community version of Gaio DataOS**!

This tutorial will walk you through the steps to run Gaio DataOS locally using Docker Desktop.

***

> **Important:**\
> Each Gaio DataOS License Account can have an **unlimited number of Community licenses**, allowing you to create multiple instances for testing, learning, or commercial use.
>
> License management (Community, SaaS, or Enterprise) is handled through your control panel:\
> 👉 [console.gaiodataos.com](https://console.gaiodataos.com)

***

### Requirements

Make sure you have [Docker Desktop](https://www.docker.com/products/docker-desktop/) installed on your machine.

> 📌 **Tip:** Docker is available for Windows, macOS, and Linux. Download the version that matches your operating system.

***

### Installation Steps

#### 1. Open Docker Desktop

* Launch Docker Desktop on your computer.

***

#### 2. Search for the Gaio DataOS image

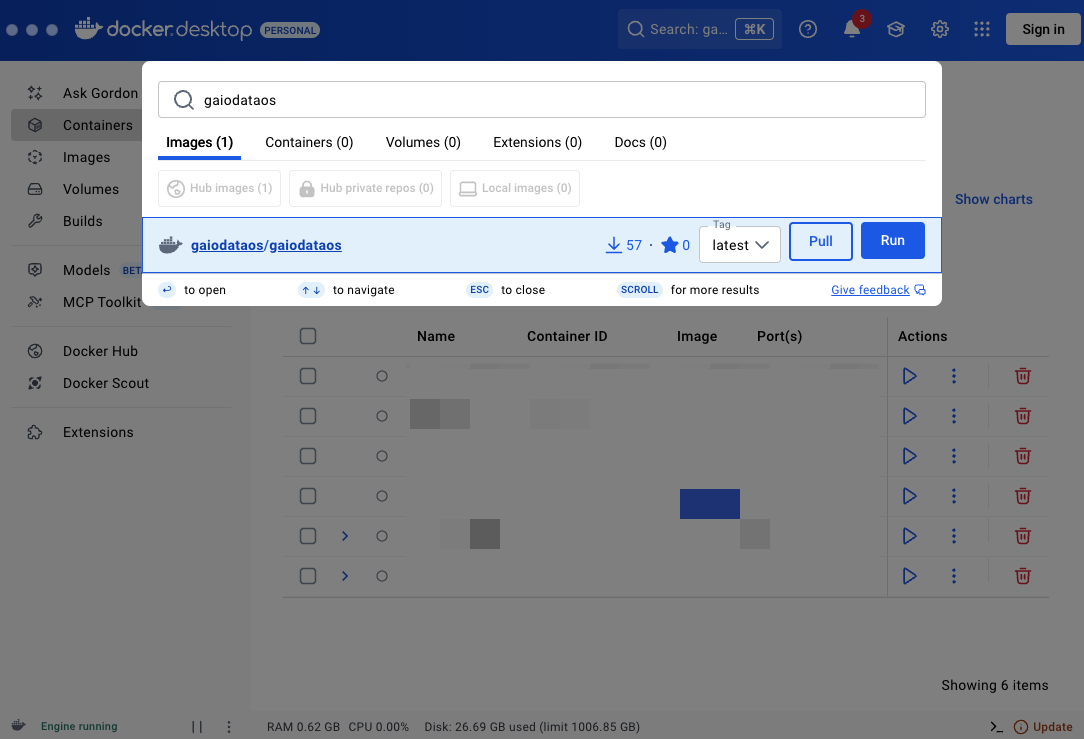
* Click the **Search** button or use the shortcut:
  * `Ctrl + K` (Windows/Linux)
  * `Cmd + K` (Mac)
* In the search field, type:

  ```
  gaiodataos
  ```

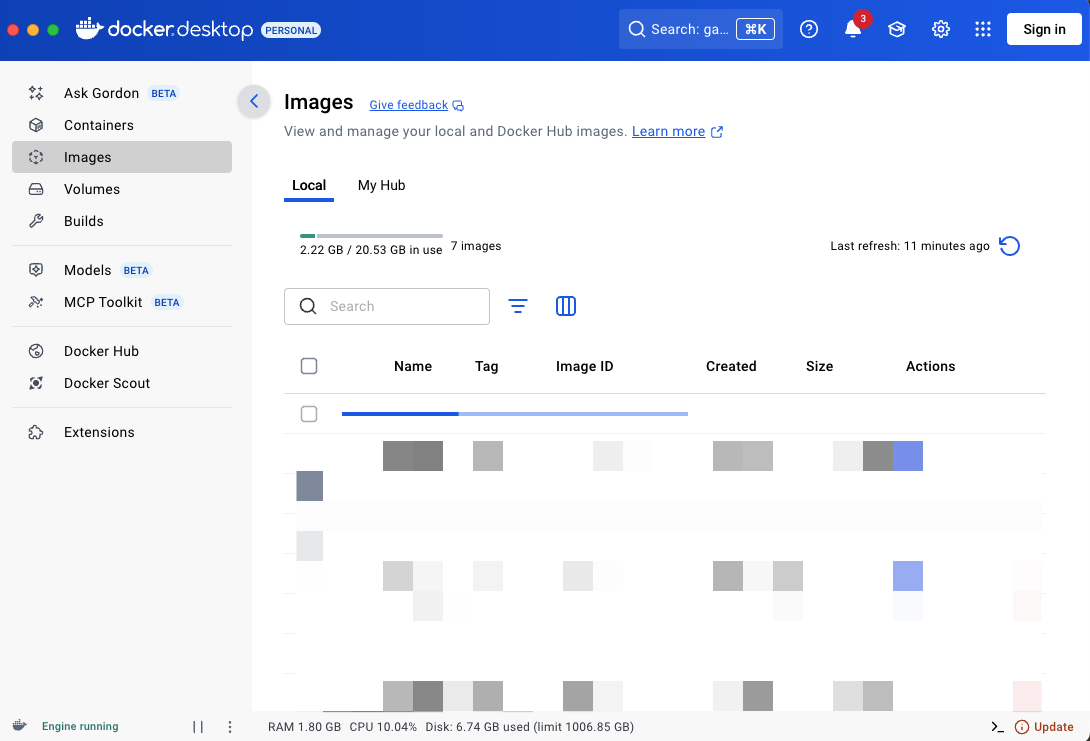
<figure><img src="/files/JQTMRBWDEzXKjX4T3426" alt=""><figcaption></figcaption></figure>

***

#### 3. Pull the image

* Click **Pull** to download the official Gaio DataOS image.

> ⏳ Please wait for the download to complete. It may take a few minutes depending on your internet speed.

<figure><img src="/files/kVHXLoRmzP7kNmhqwC0z" alt=""><figcaption></figcaption></figure>

***

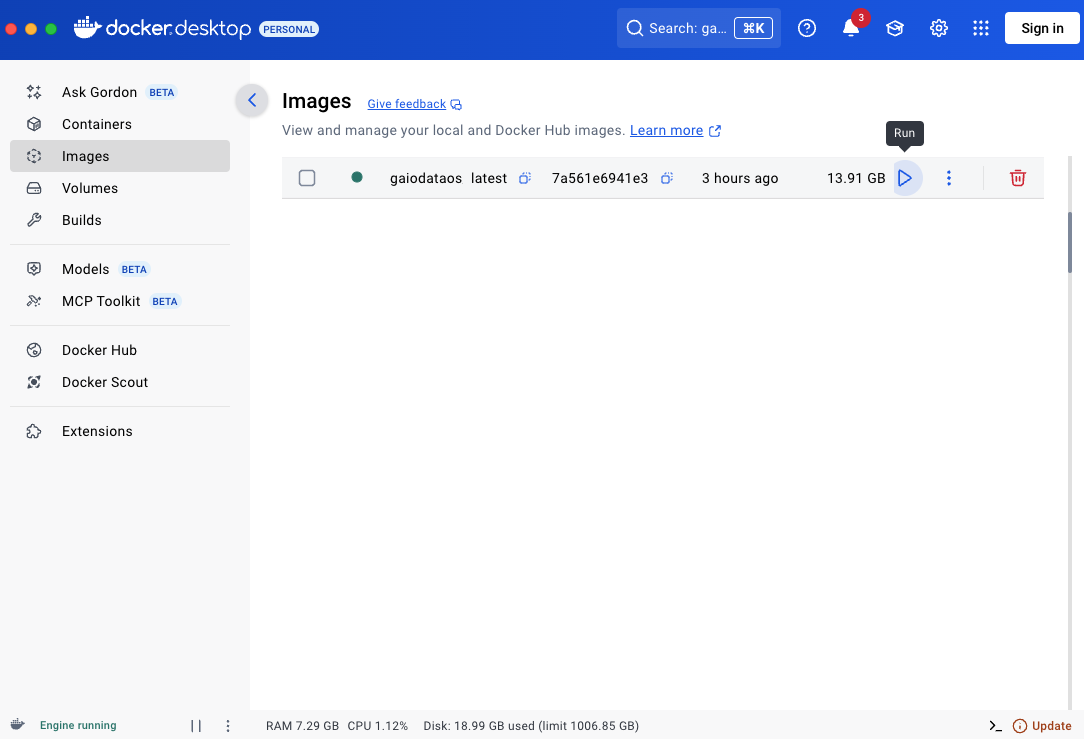
#### 4. Run the image

* Go to the **Images** tab in Docker.
* Click **Run** next to the `gaiodataos` image.

<figure><img src="/files/9BoD7pmGbRkcUjTc3Qs6" alt=""><figcaption></figcaption></figure>

***

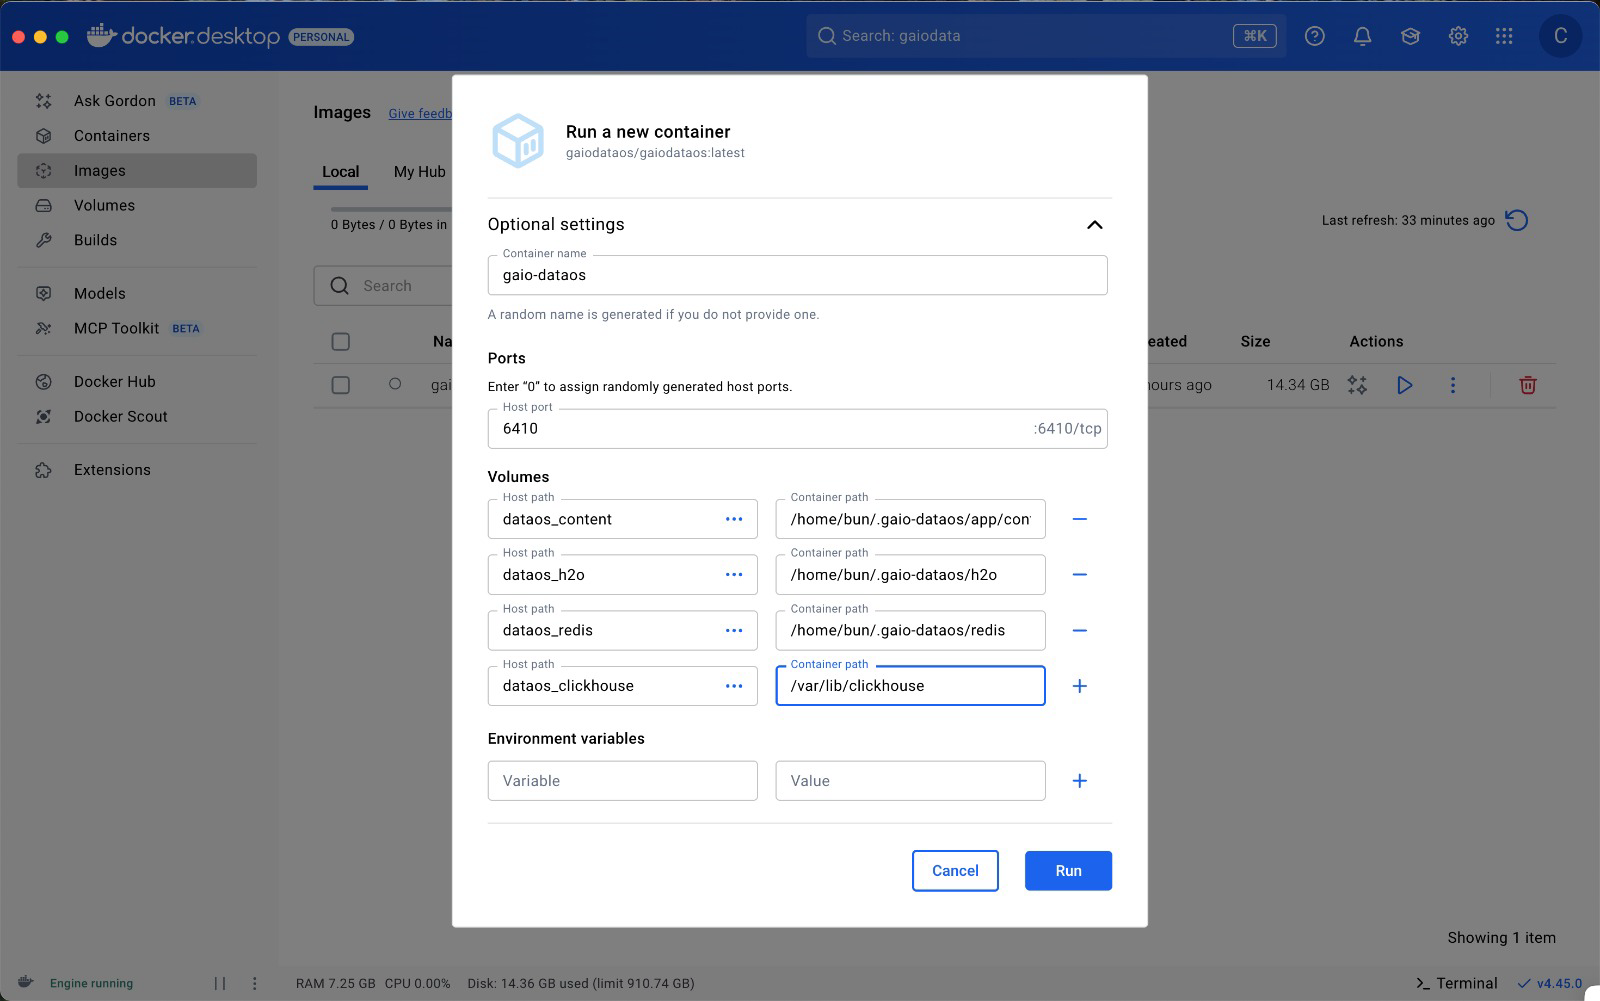
#### 5. Set up the container

* In the **Container Name** field, enter something like `gaio-dataos`.
* For **Port Mapping**, set:

  ```
  6410
  ```
* In the **Volumes** field, add:&#x20;

```
Volume 1: 
Host path: dataos_content
Container path: /home/bun/.gaio-dataos/app/content
```

```
Volume 2: 
Host path: dataos_h2o
Container path: /home/bun/.gaio-dataos/h2o
```

```
Volume 3: 
Host path: dataos_redis
Container path: /home/bun/.gaio-dataos/redis
```

```
Volume 4: 
Host path: dataos_clickhouse
Container path: /var/lib/clickhouse
```

* Click **Run Container** to launch the environment.

<figure><img src="/files/92PXfPG6MtKA2E80AhiE" alt=""><figcaption></figcaption></figure>

***

#### 6. Access the platform

* In your browser, go to:

  ```
  http://localhost:6410
  ```

***

### Initial Configuration

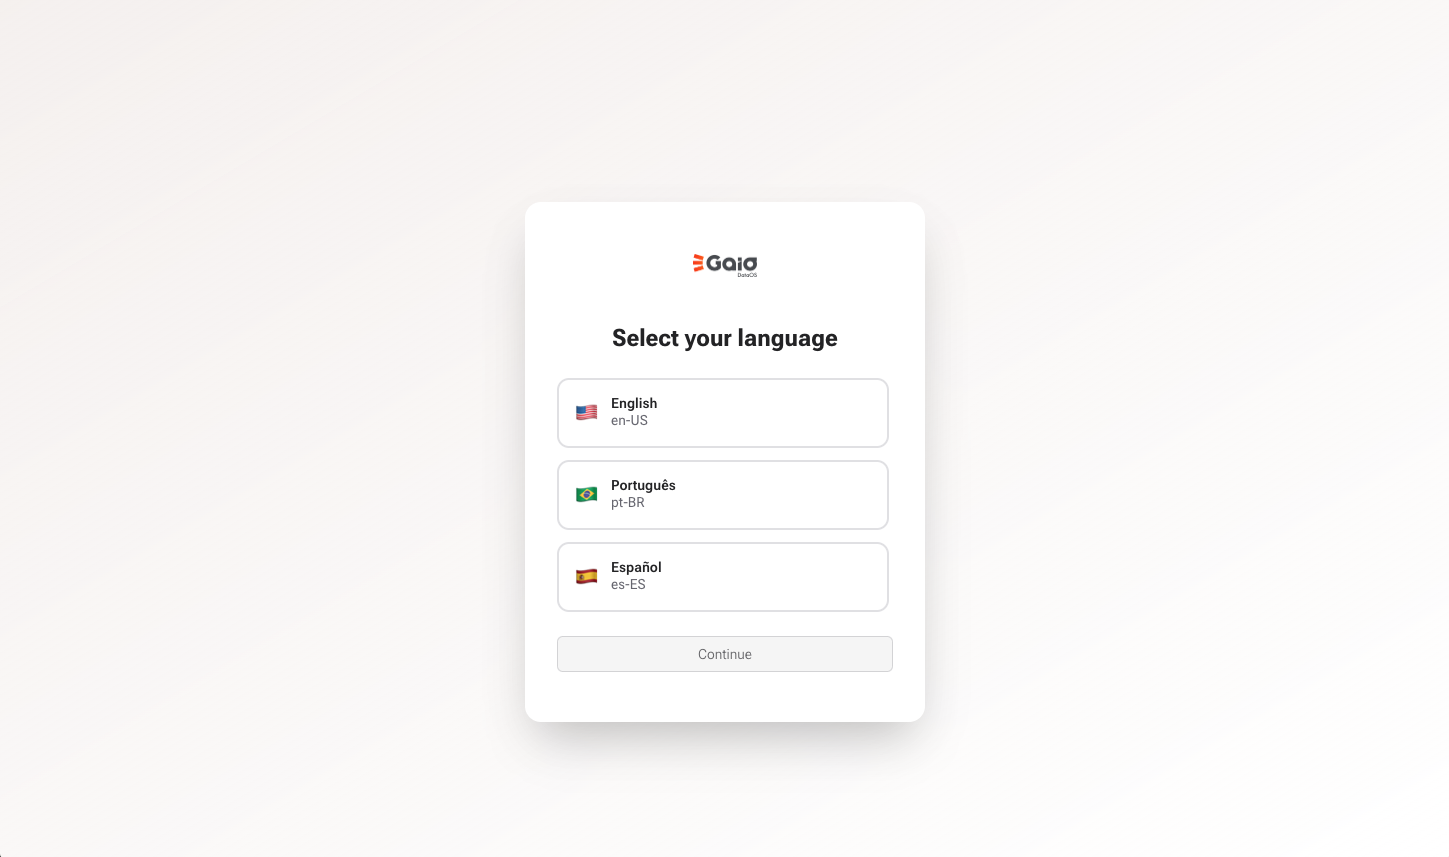
#### 1. Choose your language

* On the welcome screen, select your preferred language.

<figure><img src="/files/u4jUfk1VRKKGdQmqs5Ry" alt=""><figcaption></figcaption></figure>

***

#### 2. Enter your email

* Type in a valid email address to proceed.

<figure><img src="/files/NxMN989mU92YmbJaFjGh" alt=""><figcaption></figcaption></figure>

***

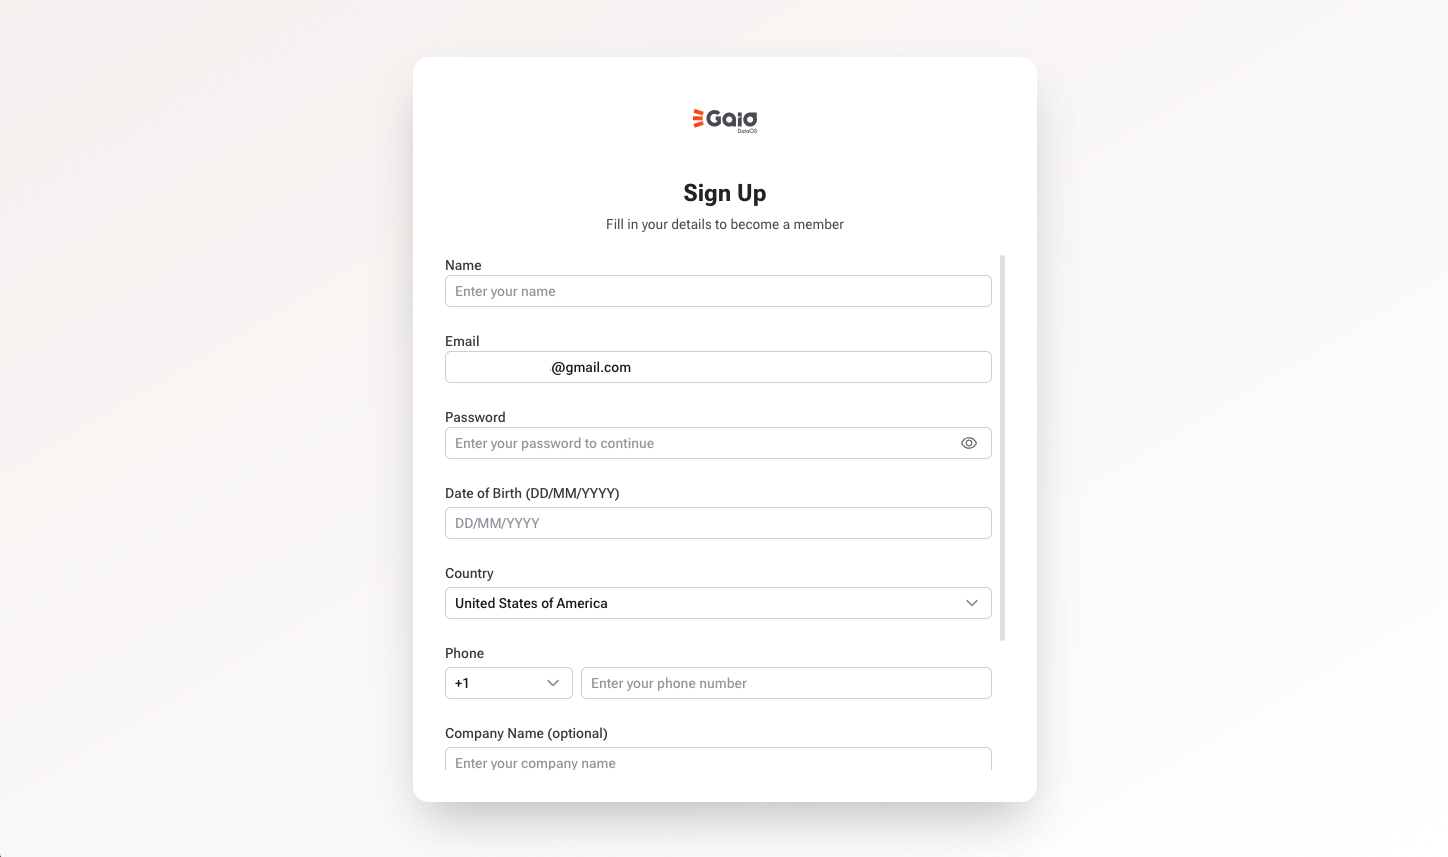
#### 3. Create your Gaio DataOS license

* If you don’t already have a Gaio DataOS License Account:
  * Fill out the form displayed.
  * Click **Submit** to generate your Gaio DataOS License Account.

<figure><img src="/files/qXsCZB2O1FVQdVa8lDlQ" alt=""><figcaption></figcaption></figure>

***

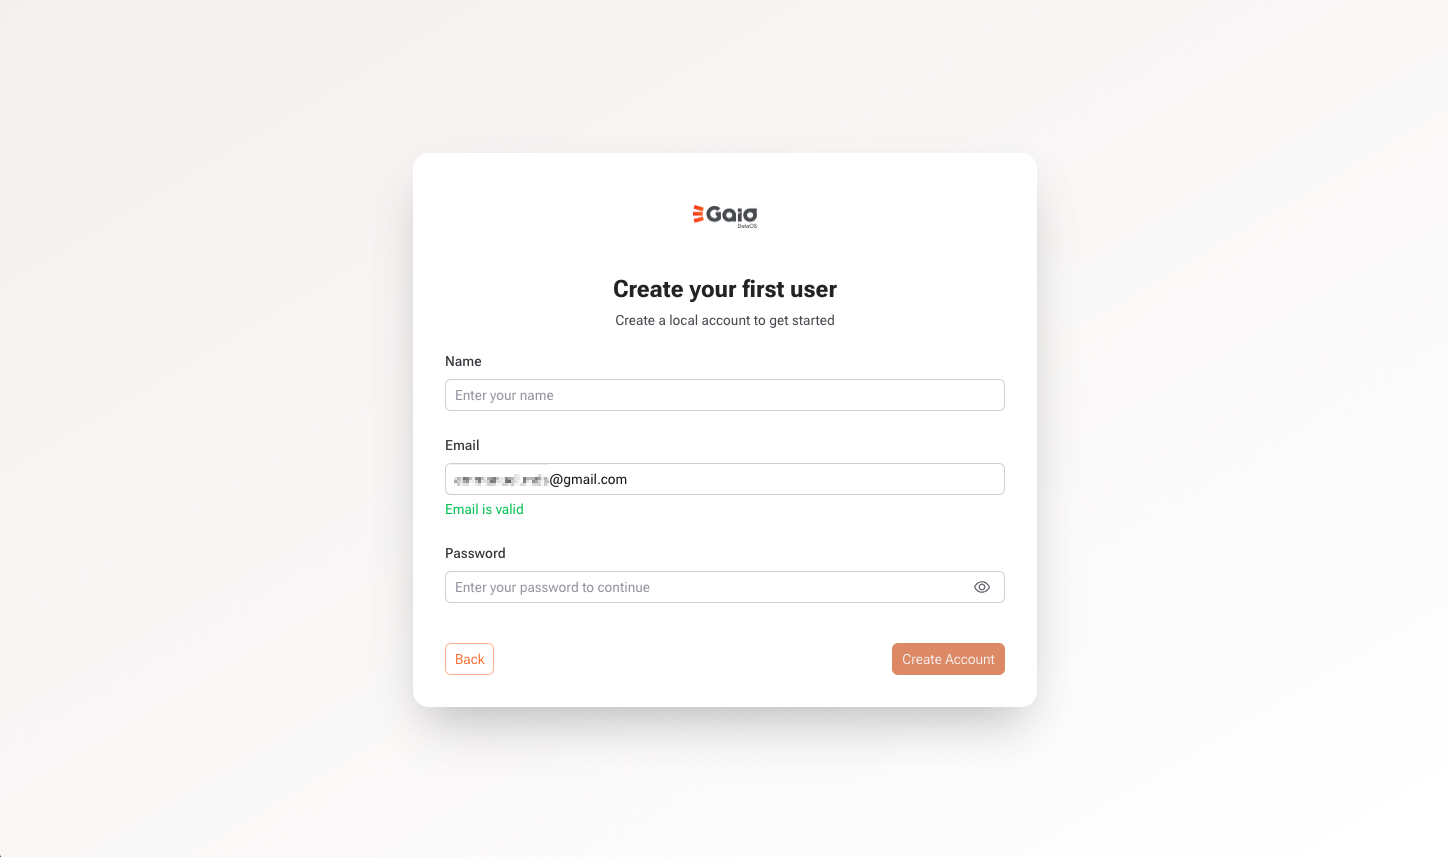
#### 4. Create your local user account

* After the license is created, you’ll be prompted to set up a **local user account**.
* This account will be your login to access the platform on this machine.

> The Community version allows you to create local users for each installed instance of Gaio.

<figure><img src="/files/0Z2BkPthEdTfUUrK2XH8" alt=""><figcaption></figcaption></figure>

***

### You're all set!

Congratulations! You’ve successfully installed Gaio DataOS.&#x20;

You can now:

* Import and process data
* Build dashboards and APIs
* Automate data flows
* Use integrated AI features
* And much more&#x20;

<figure><img src="/files/4CBs3DFIktUJdegpij5O" alt=""><figcaption></figcaption></figure>

***

### **Gaio DataOS — Docker Image Update Instructions**

#### **Pulling the Latest or a Specific Version**

You can also use the command line to pull the latest, or a specific version:

```bash
# Pull latest (stable) version
docker pull gaiodataos/gaiodataos

# Pull specific version
docker pull gaiodataos/gaiodataos:v0.0.800
```

***

#### **Restarting the Container After Update**

After pulling the updated image, stop your `gaiodataos` container and start it again.\
You can also use the command line. Replace `<container_id>` in the commands below with the container ID you find in the first command:

```bash
# Find your container ID
docker ps -a

# Stop the container with the `<container_id>`
docker stop <container_id>

# Remove the container with the `<container_id>`
docker rm <container_id>

# Start the container - Pull latest (stable) version
docker run --pull always --name gaio-dataos -p 6410:6410 -v dataos_content:/home/bun/.gaio-dataos/app/content -v dataos_h2o:/home/bun/.gaio-dataos/h2o -v dataos_redis:/home/bun/.gaio-dataos/redis  -v dataos_clickhouse:/var/lib/clickhouse gaiodataos/gaiodataos:latest

# Start the container - Pull specific version
docker run --pull always --name gaio-dataos -p 6410:6410 -v dataos_content:/home/bun/.gaio-dataos/app/content -v dataos_h2o:/home/bun/.gaio-dataos/h2o -v dataos_redis:/home/bun/.gaio-dataos/redis  -v dataos_clickhouse:/var/lib/clickhouse gaiodataos/gaiodataos:v0.0.800
```

***

### Need help?

We're here to support you: <https://gaio.discourse.group/>


# Change GAIO Community password

#### Reset GAIO Community Password

1. **Open your terminal as Administrator**

   Run all the following commands inside the terminal.
2. **List all containers**

   ```undefined
   docker ps

   ```
3. **Access the container**\
   Replace `<container_id>` with the ID of the container where GAIO is running.

   ```bash
   docker exec -it <container_id> /bin/bash

   ```
4. **Open the ClickHouse client**

   ```scss
   clickhouse-client -u default --password Ldnq8y04MekEH4QCYPscVA

   ```
5. **Update the user password in the table**

   ```swift
   ALTER TABLE gaioadmin.user UPDATE password = '$argon2id$v=19$m=65536,t=2,p=1$f6hAIuOvqcyxcN3XN1mo/Qu4O1EBYzICvpZhTHSJNZw$x5uYYg6xJxv1GY9ZguS45qWNtZdTmAoRFnaNtCEz0/o' WHERE email = 'YOUR-EMAIL-HERE';

   ```
6. **Log in to GAIO**\
   You can now log in to GAIO using the password: **@GAIO123**

***

### Need help?

We're here to support you: <https://gaio.discourse.group/>


# Tutorials: Gaio In Minutes

**Gaio In Minutes** is a curated video playlist designed to help you quickly understand and start using **Gaio DataOS** — from the fundamentals to advanced use cases involving data analysis and AI. This section serves as a **guided entry point** for users who prefer learning through short, practical videos.

## What Is Gaio In Minutes?

Gaio In Minutes is a step-by-step video series that explains:

* What Gaio DataOS is and how it works.
* Core concepts and platform navigation.
* Data ingestion and transformation.
* Analytics, dashboards, and workflows.
* AI-powered features available in the platform.

## How to access

1. To access Gaio In Minutes, simply open the official YouTube playlist, [click here](https://www.youtube.com/watch?v=hxfdeXwRt7w\&list=PLjdN_xDoxFpUizQBYwO9j5EJh54f9kzdL).
2. Select the subject of your interesting.
3. &#x20;All set! Enjoy and talk with us if you have any doubts!


# Data Projects

<figure><img src="/files/nylHzmRWD6bb4fc2WJqR" alt=""><figcaption></figcaption></figure>

A **Data Project** in **Gaio DataOS** is an isolated and structured environment where all your data-related activities take place — from ingestion to advanced analytics.

### &#x20;Key Characteristics

* **Modular Workspace**:\
  Each project serves as a dedicated workspace where you can:
  * Connect to various **data sources**
  * Build **data preparation flows**
  * Design and share **dashboards**
  * Set up **automations**
  * Train and deploy **machine learning models**
* **Isolated Data Bucket**:\
  Every Data Project generates its own **data bucket**, ensuring that datasets, assets, and transformations are completely separated from other projects.
* **Access Control**:\
  Permissions are managed through **user roles** and **group-based access rules**, providing full control over who can view, edit, or manage each project component.

### Use Cases

* Creating custom analytics environments for different teams or clients
* Separating test, staging, and production pipelines
* Managing access to sensitive data with role-based control
* Deploying machine learning workflows in a self-contained, governed context

## Creating a New Data Project

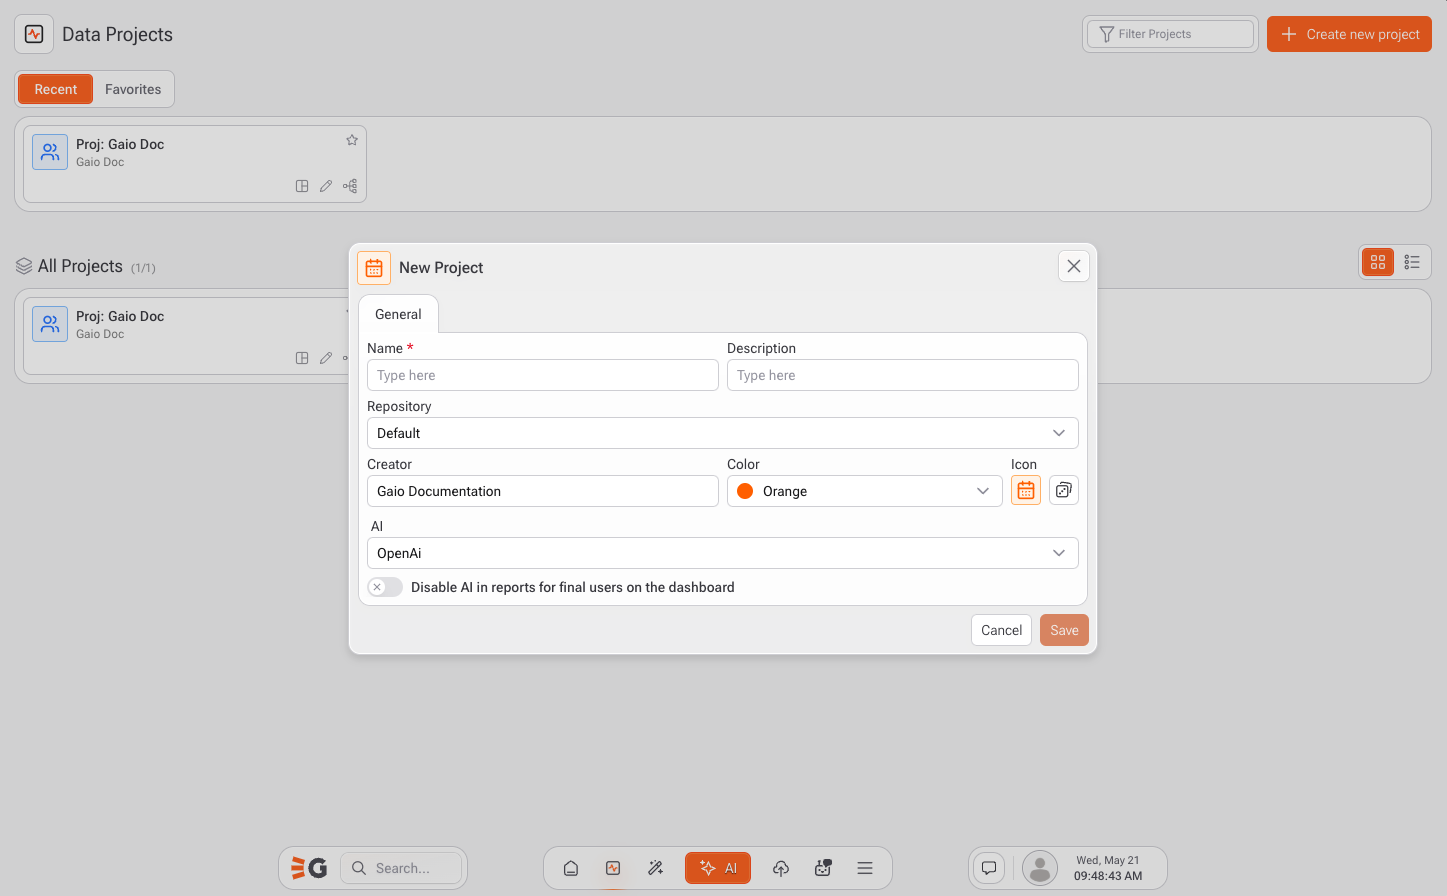
The **New Project** screen allows you to configure a dedicated environment to organize your data, analysis, and visualizations within Gaio DataOS.

### Step-by-Step Instructions

1. **Click on** `+ Create new project` located in the upper right corner of the project dashboard.
2. The **New Project** window will appear with the following fields:
   * **Name** (required):\
     Enter the name of your project. This will be the display title in your project list.
   * **Description** (optional):\
     Provide a brief summary of the project's purpose or contents.
   * **Repository**:\
     Select the data repository where your assets will be stored. Default is set to `Default`.
   * **Creator**:\
     This field is automatically populated with your user or team name (e.g., *Gaio Documentation*).
   * **Color**:\
     Choose a highlight color to visually identify the project (e.g., `Orange`).
   * **Icon**:\
     Pick an icon that represents the project context (e.g., 📅 calendar icon).
   * **AI** (optional):\
     Select the AI engine (e.g., `OpenAI`) to power intelligent features inside the project.\
     Optionally, enable the checkbox `Disable AI in reports for final users on the dashboard` to prevent AI suggestions in end-user dashboards.
3. **Click** `Save` to create the project or `Cancel` to exit without saving.


# Studio

<figure><img src="/files/KCHX3r0m4zCZPnglOo3V" alt=""><figcaption></figcaption></figure>

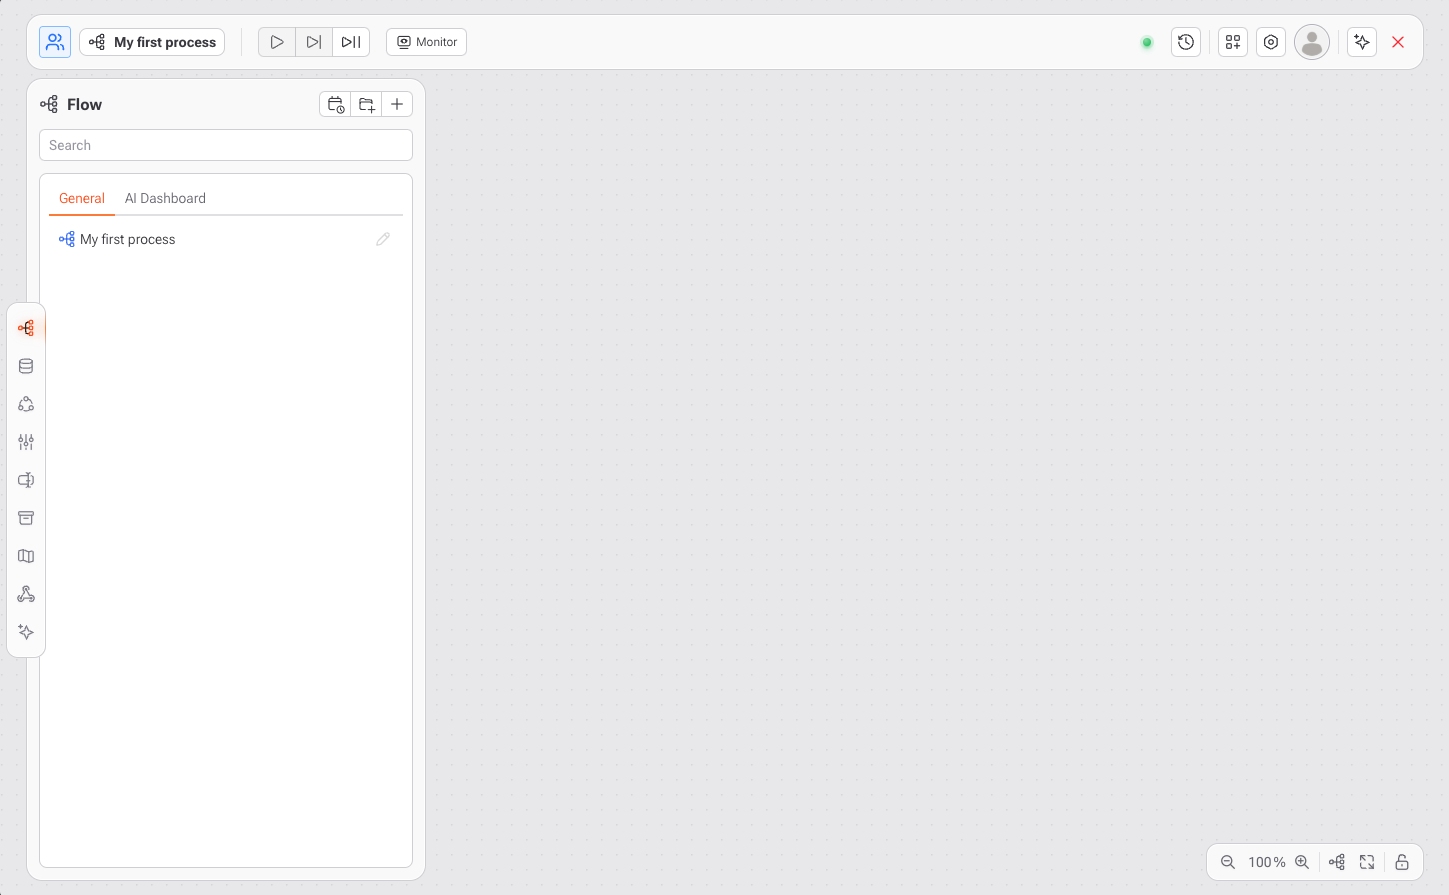
The **Studio** is the core environment inside a **Data Project** where users can build, orchestrate, and automate data workflows. It provides a visual interface and powerful tools for data development, automation, analytics, and API integration.

## Main Sections of the Studio

Below are the primary menus available in the Studio, each with a specific purpose:

### **Flow**

* The **Flow** tab is where you create and manage **data processes**.
* Users can visually construct workflows that include SQL queries, Python scripts, dashboards, and more.
* Each process represents a step or logic within the data pipeline.

### **Source**

* Provides access to data **generated inside the project** and to **external data sources**.
* Only data sources **previously configured by an admin user** in the system settings will be available here.
* Developers can explore and query datasets available in their permission scope.

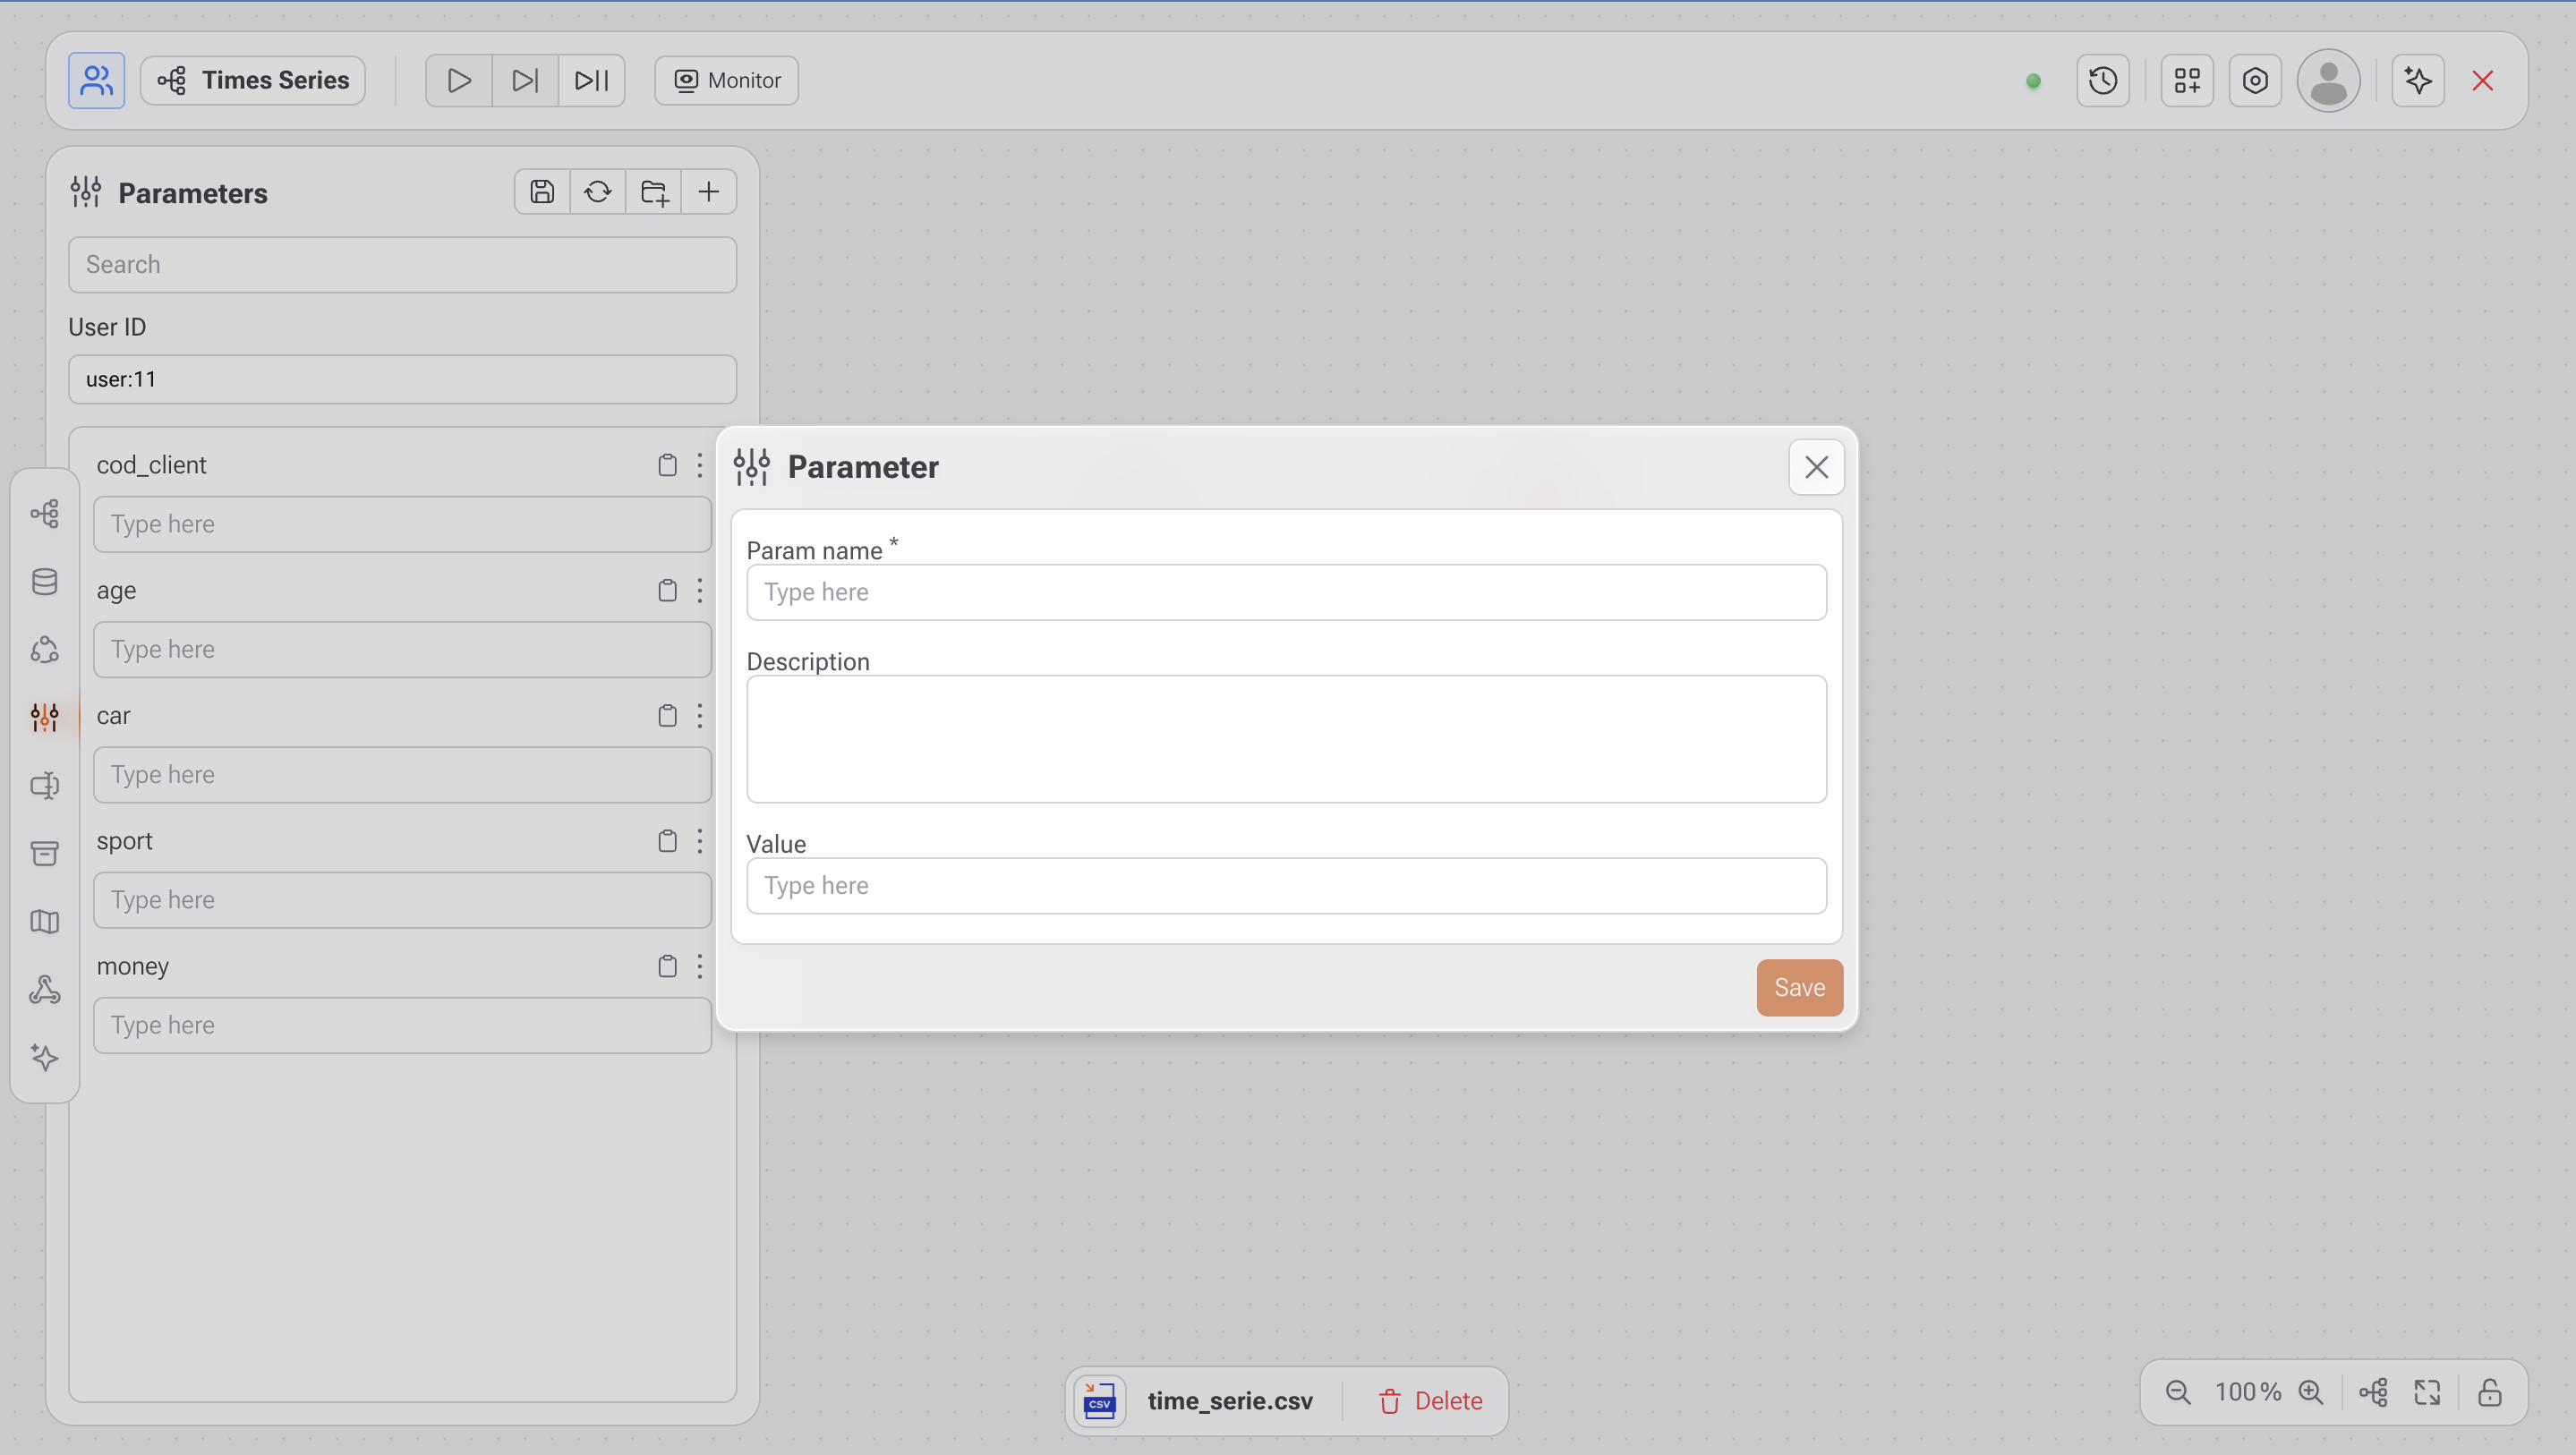
### **Parameters**

* Acts as a central hub for **variables** used within processes.
* Parameters can be:
  * Applied in **filters**
  * Set as **environment variables**
  * Used to **pass values** between SQL queries and Python/JavaScript code blocks.

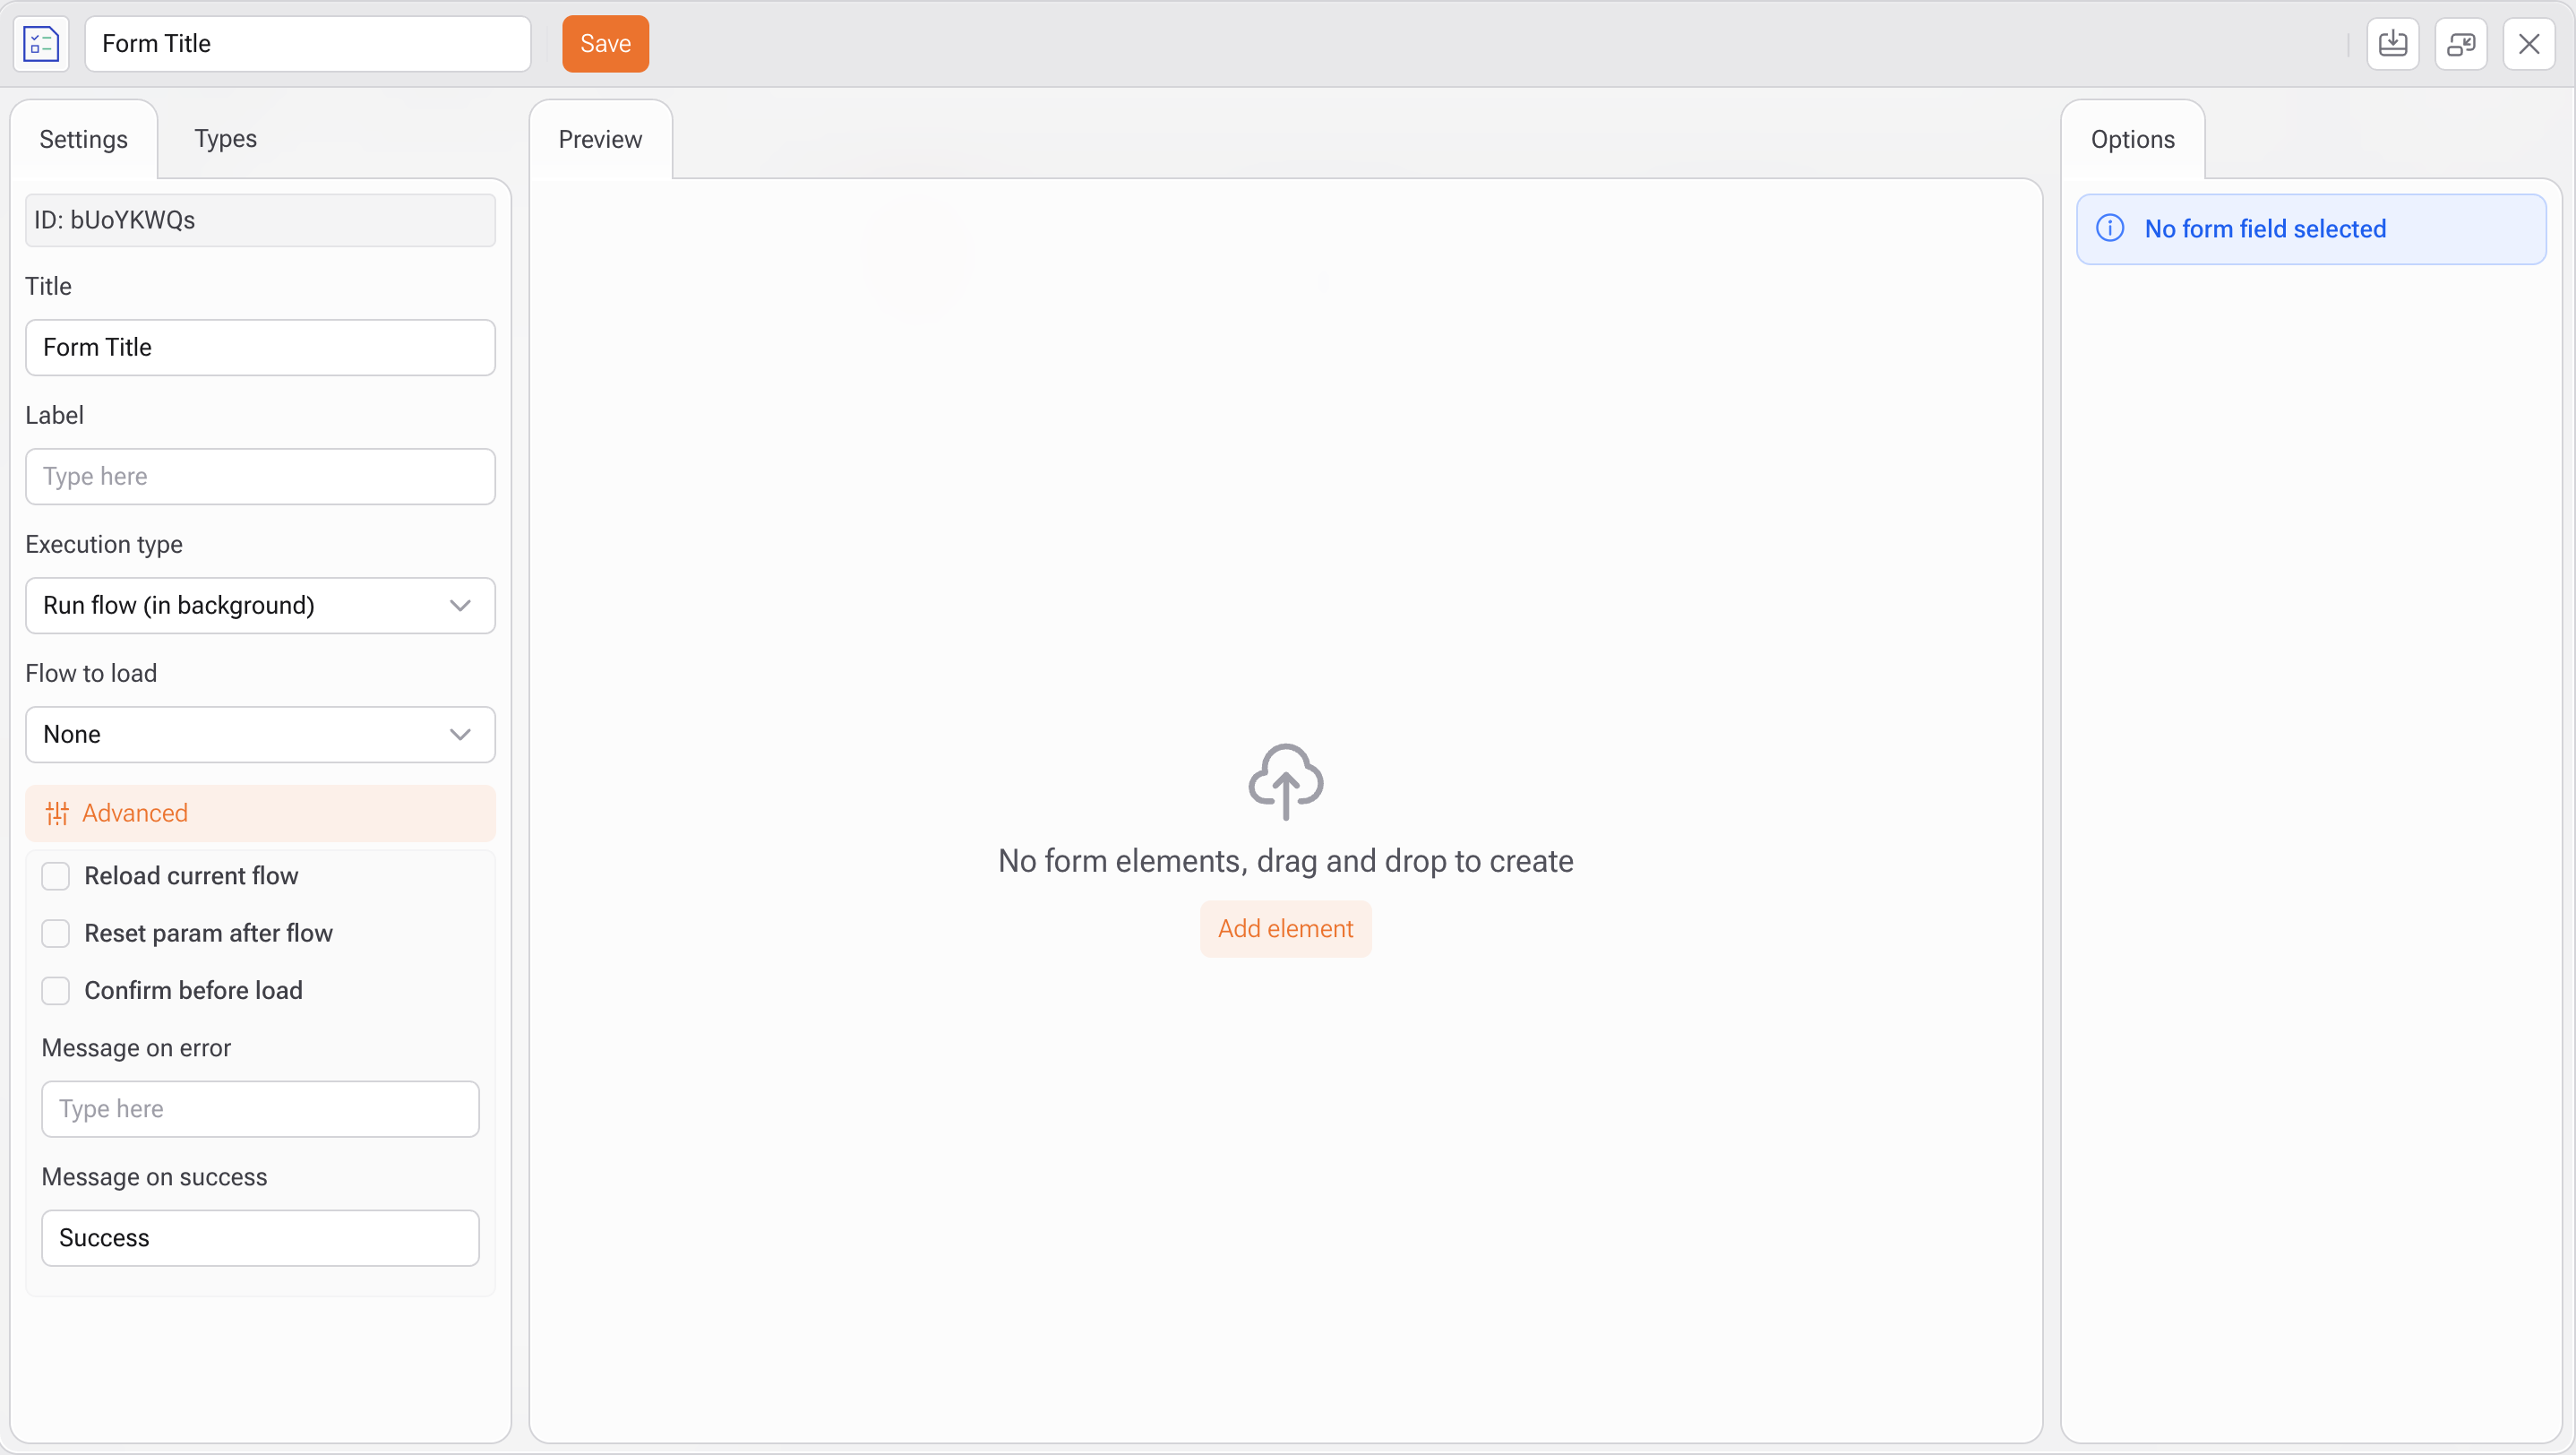
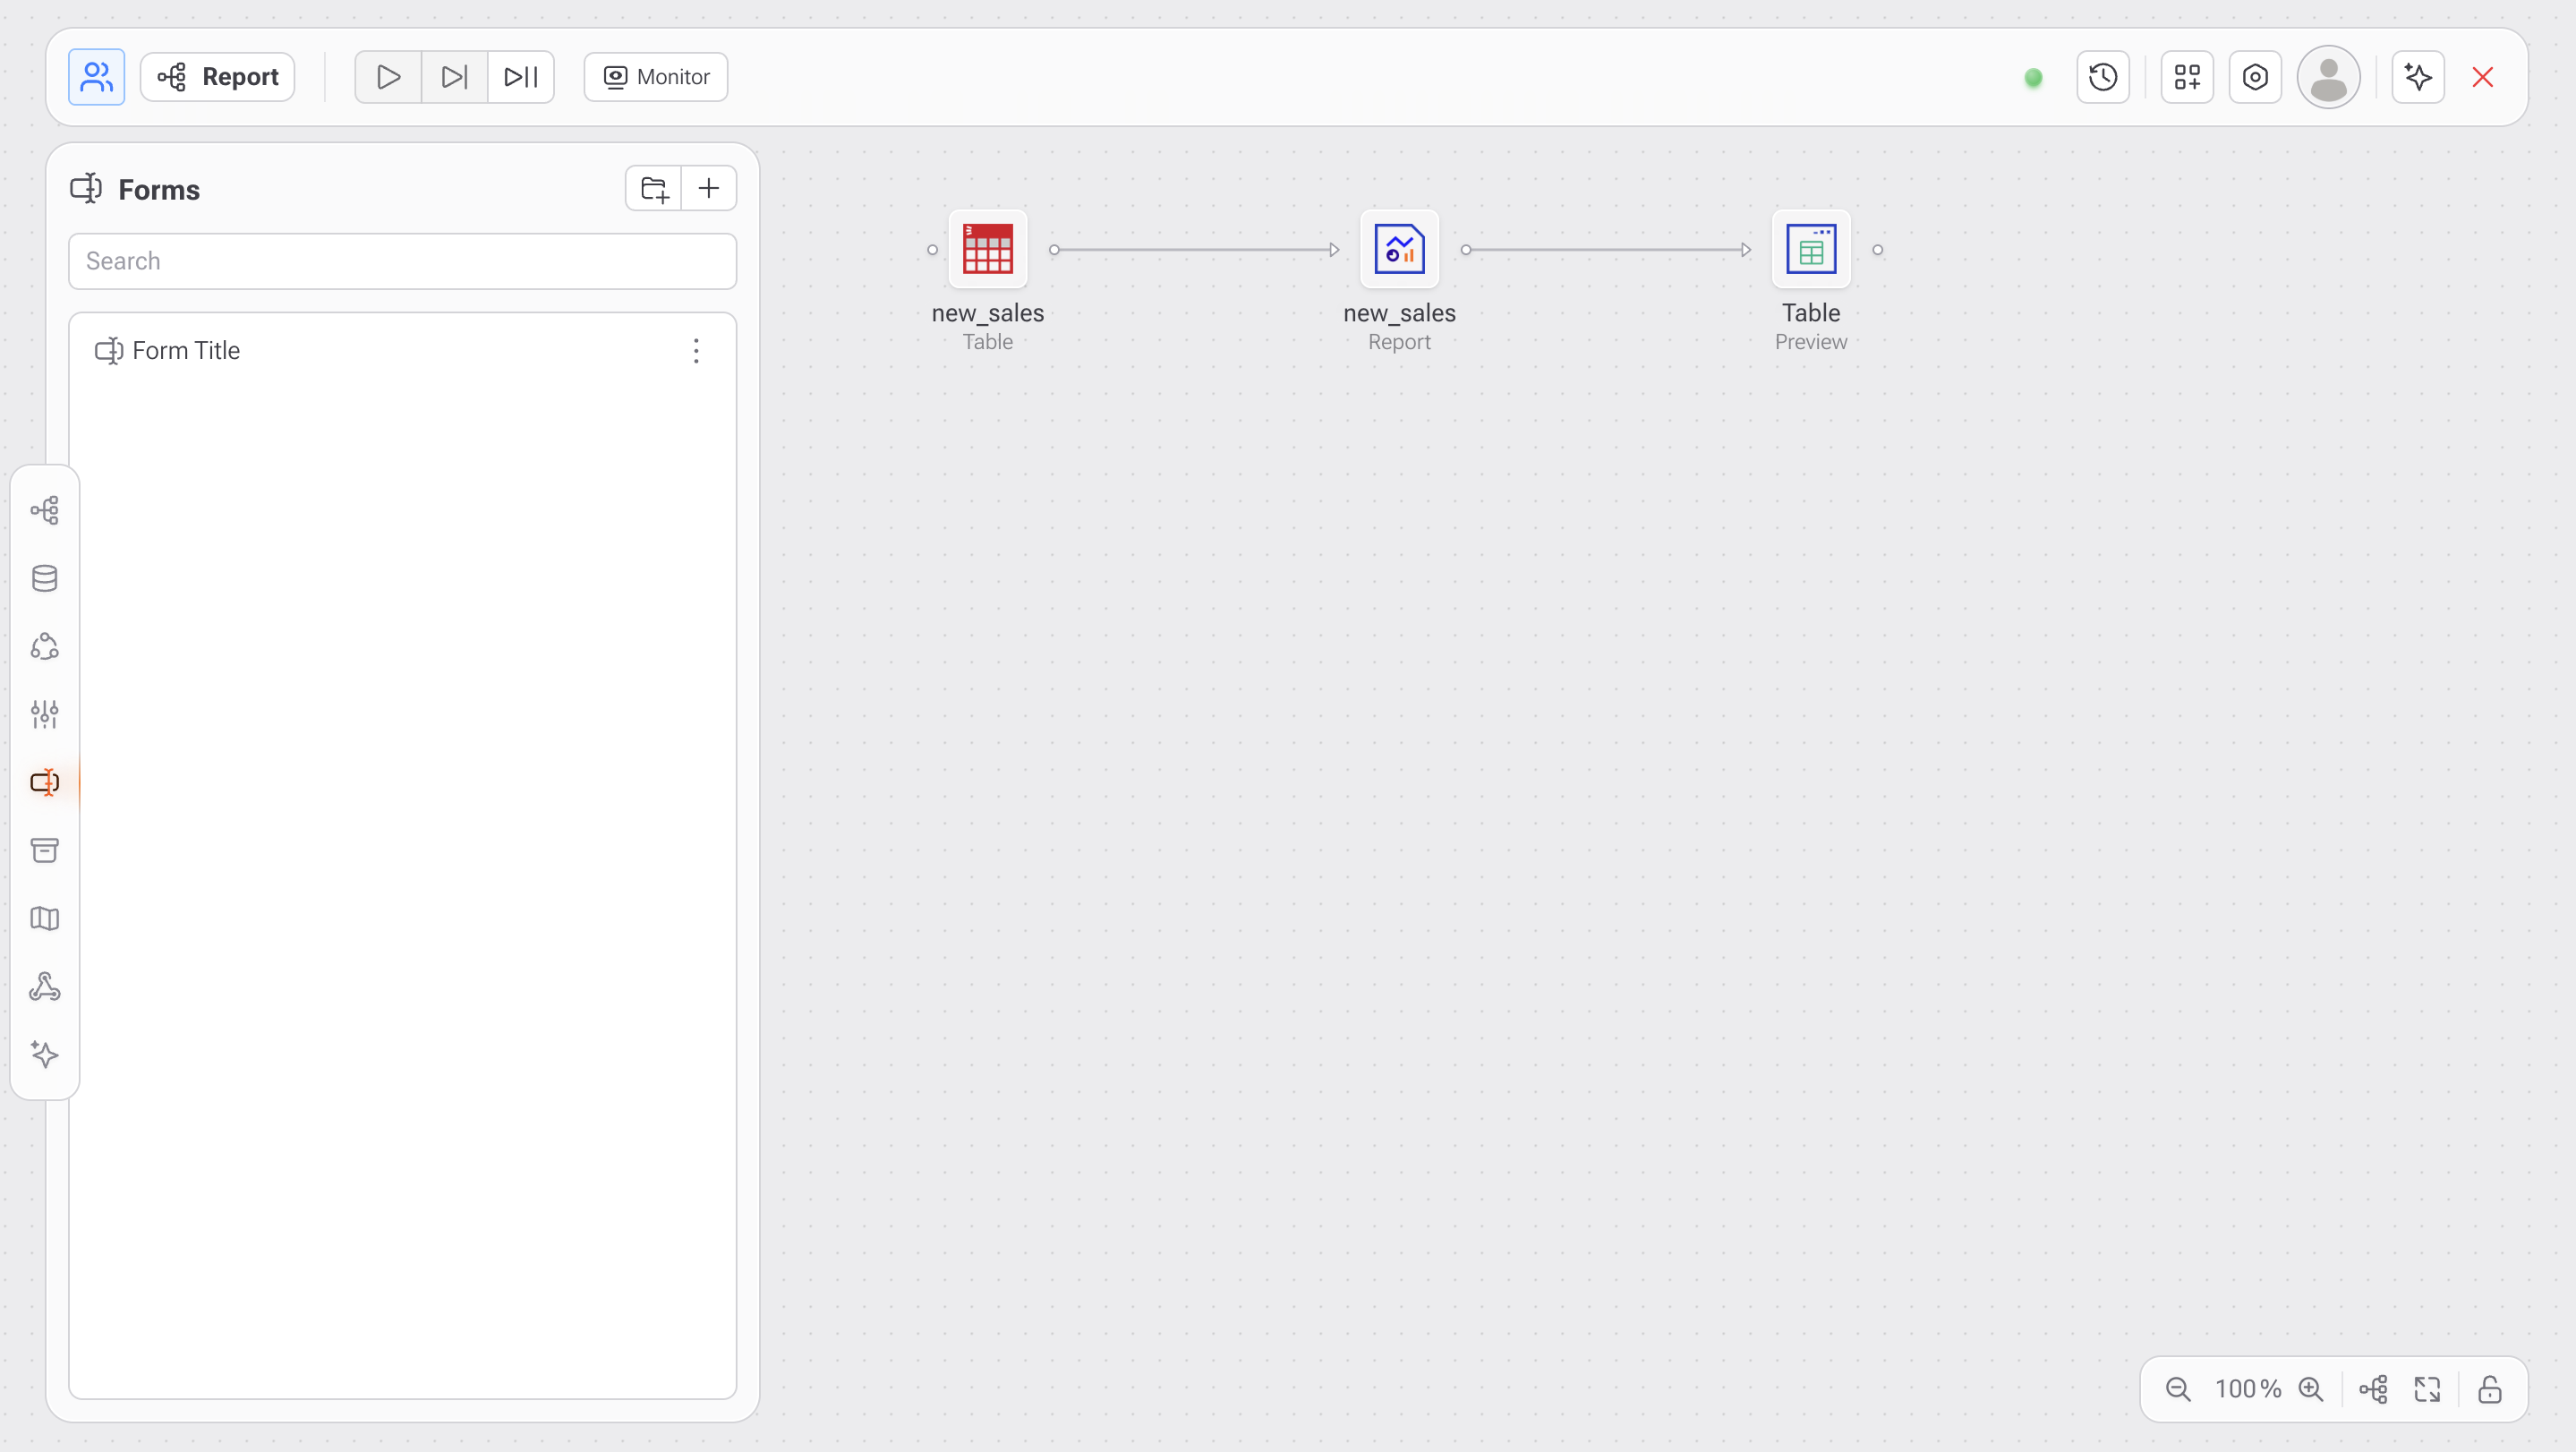
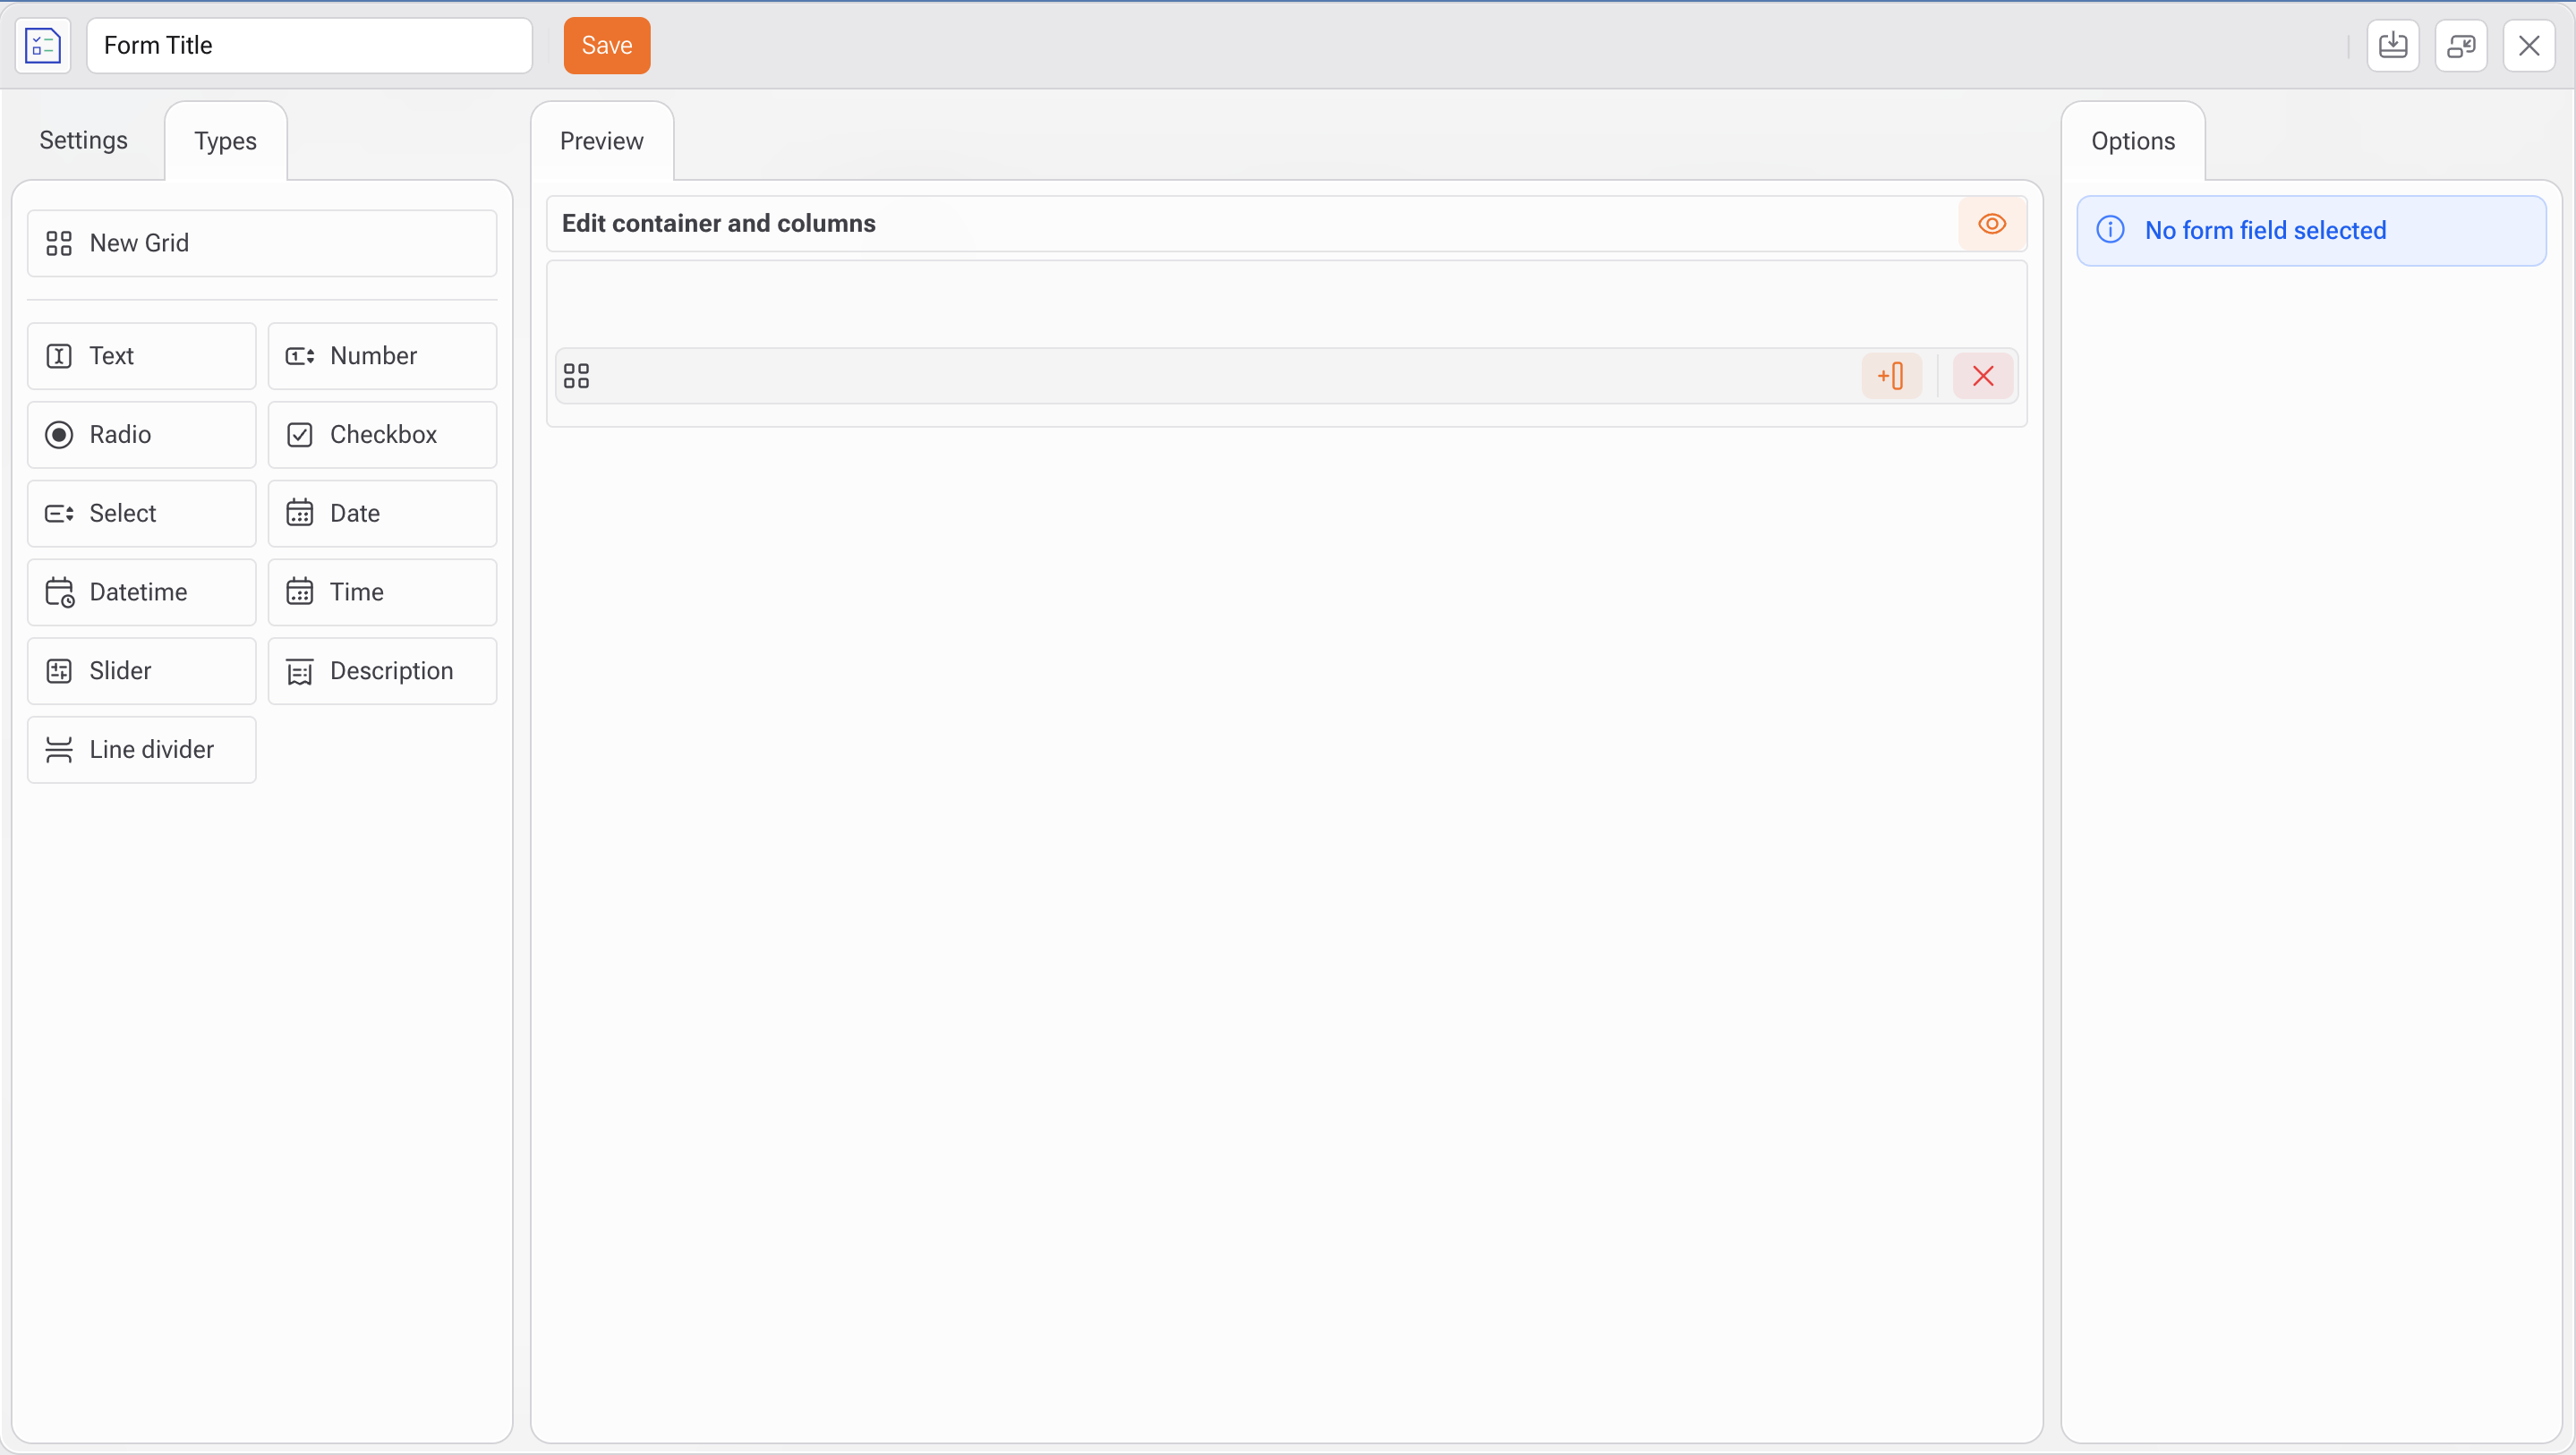
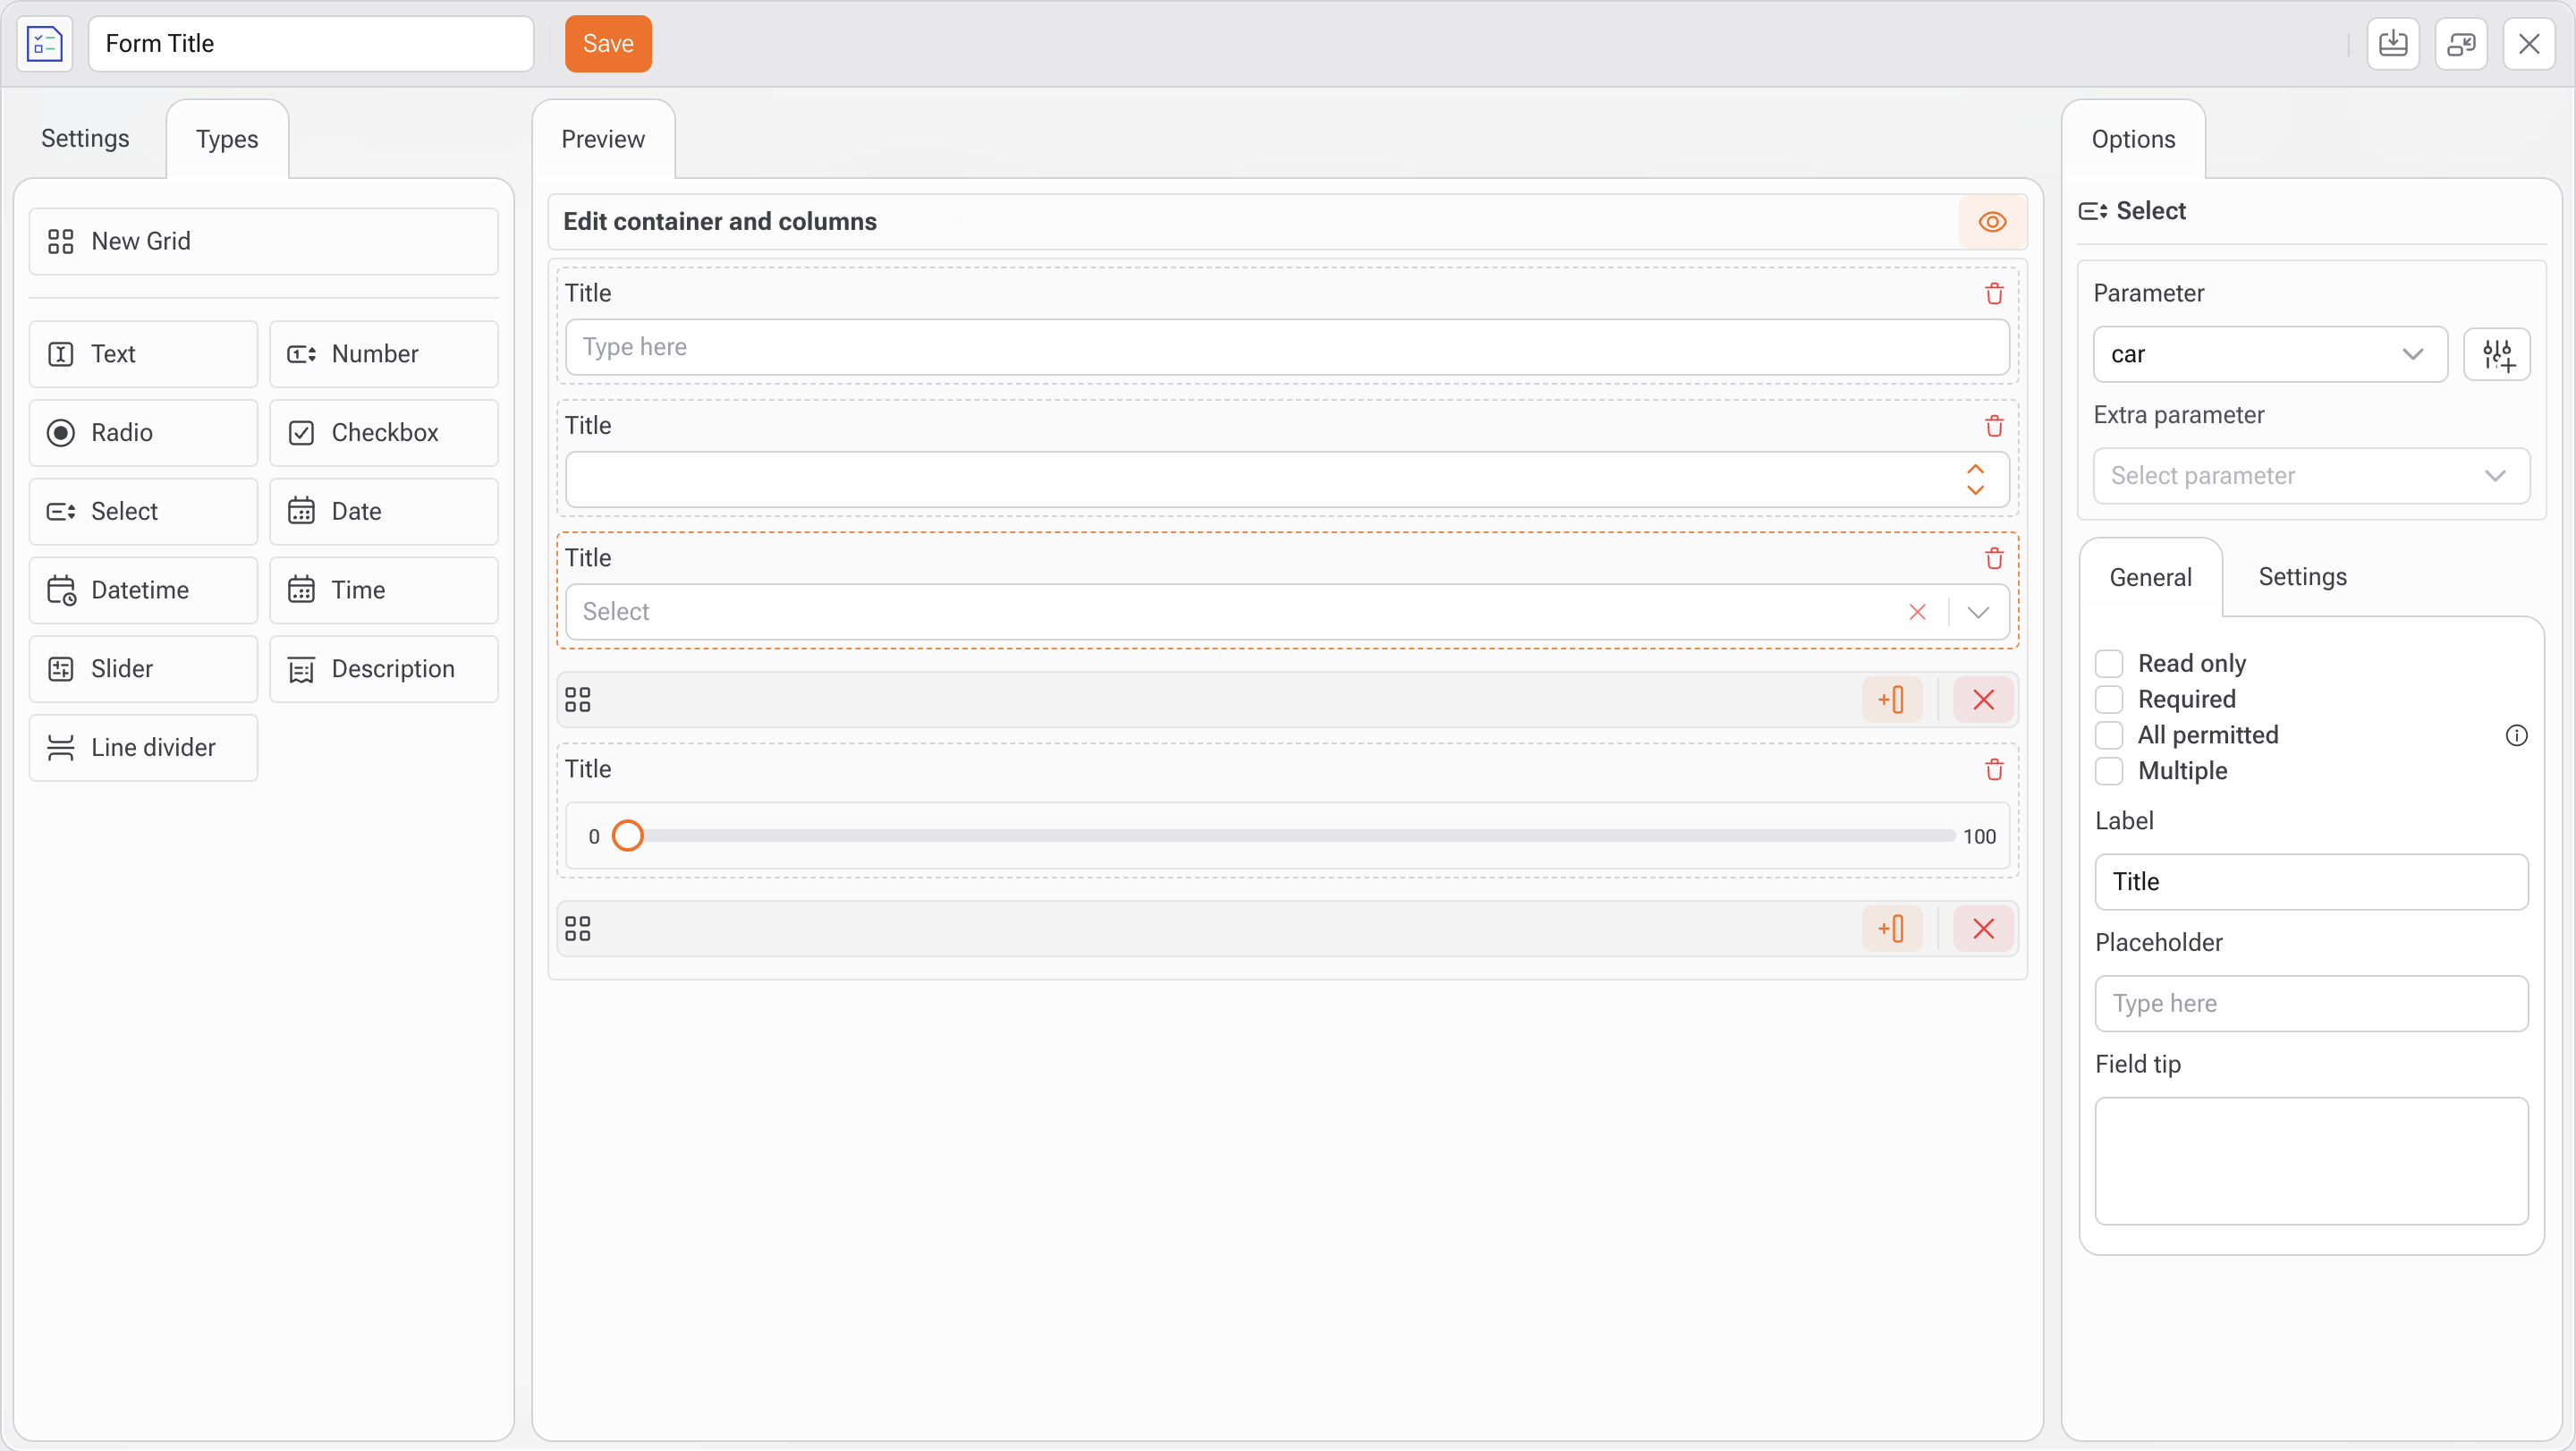
### **Form**

* Used to create **input forms** for dashboards or data entry.
* Forms can be linked to trigger **data flows**, making them powerful tools for user interaction and workflow automation.
* Ideal for building dynamic and interactive reports.

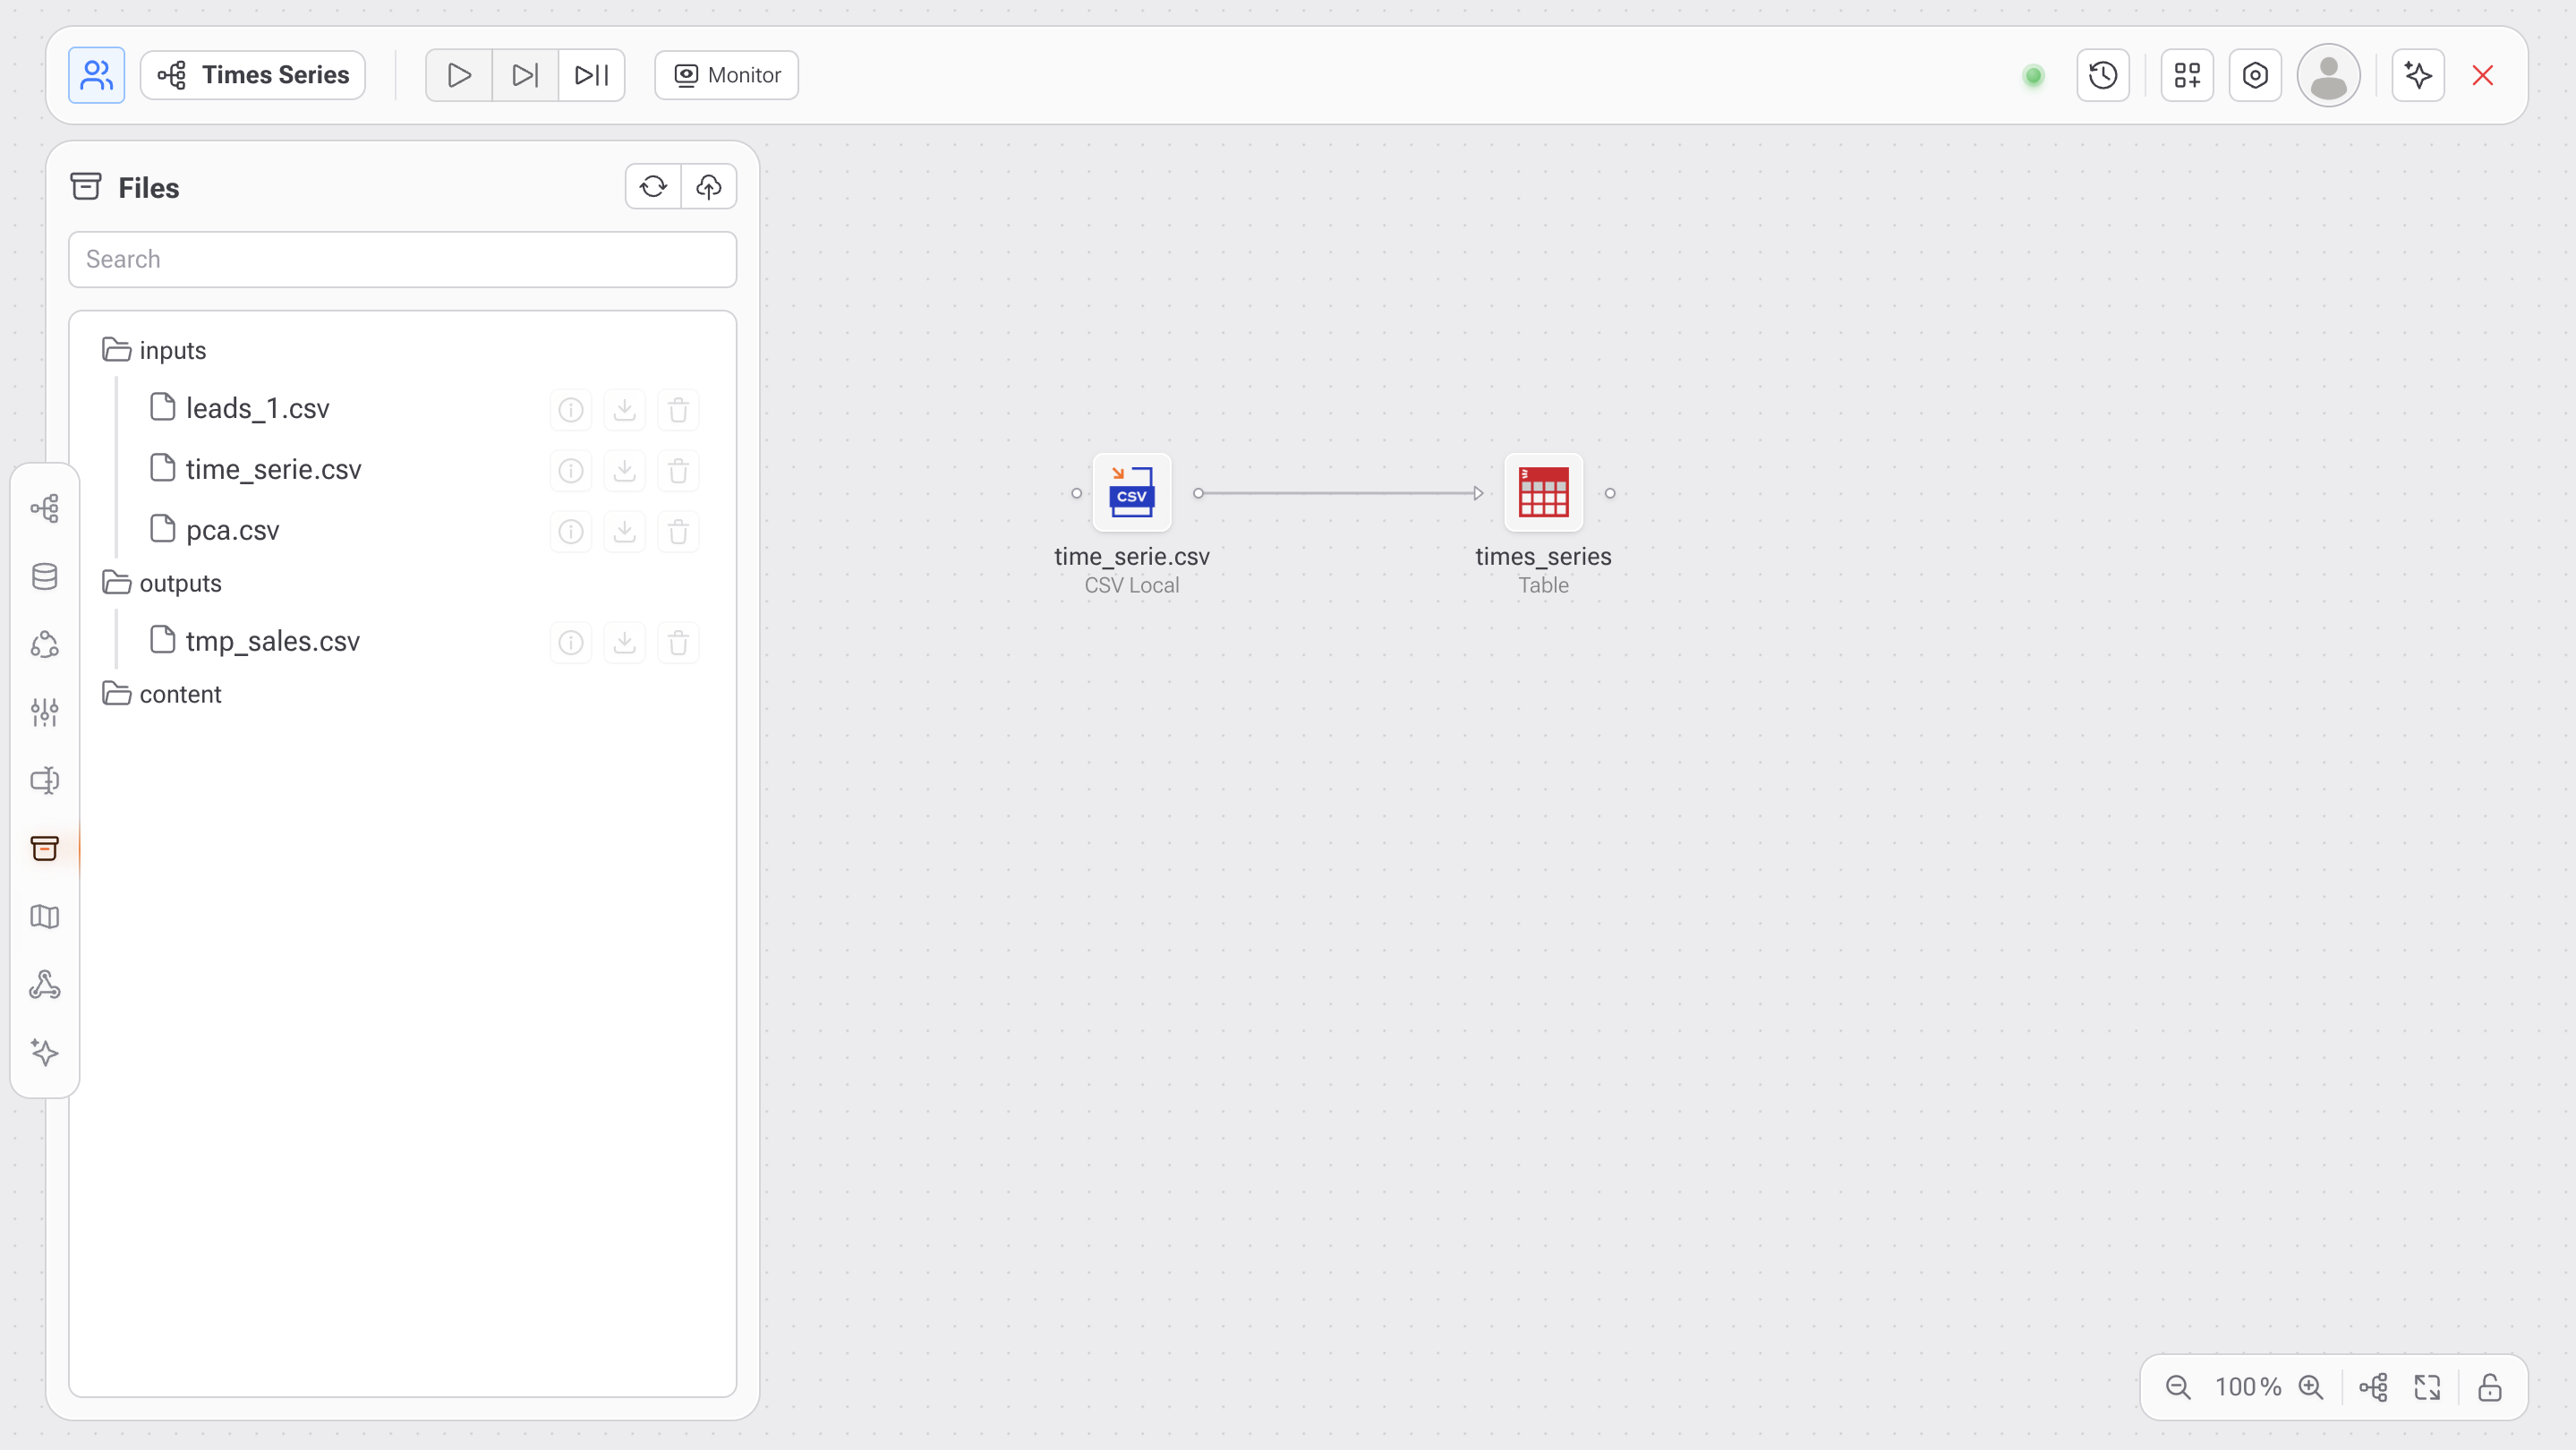
### **Files**

* A space for **uploading files** such as:
  * CSV
  * Excel spreadsheets
  * PDFs
  * Images
  * Videos
* Uploaded files can be processed and integrated into your flows.

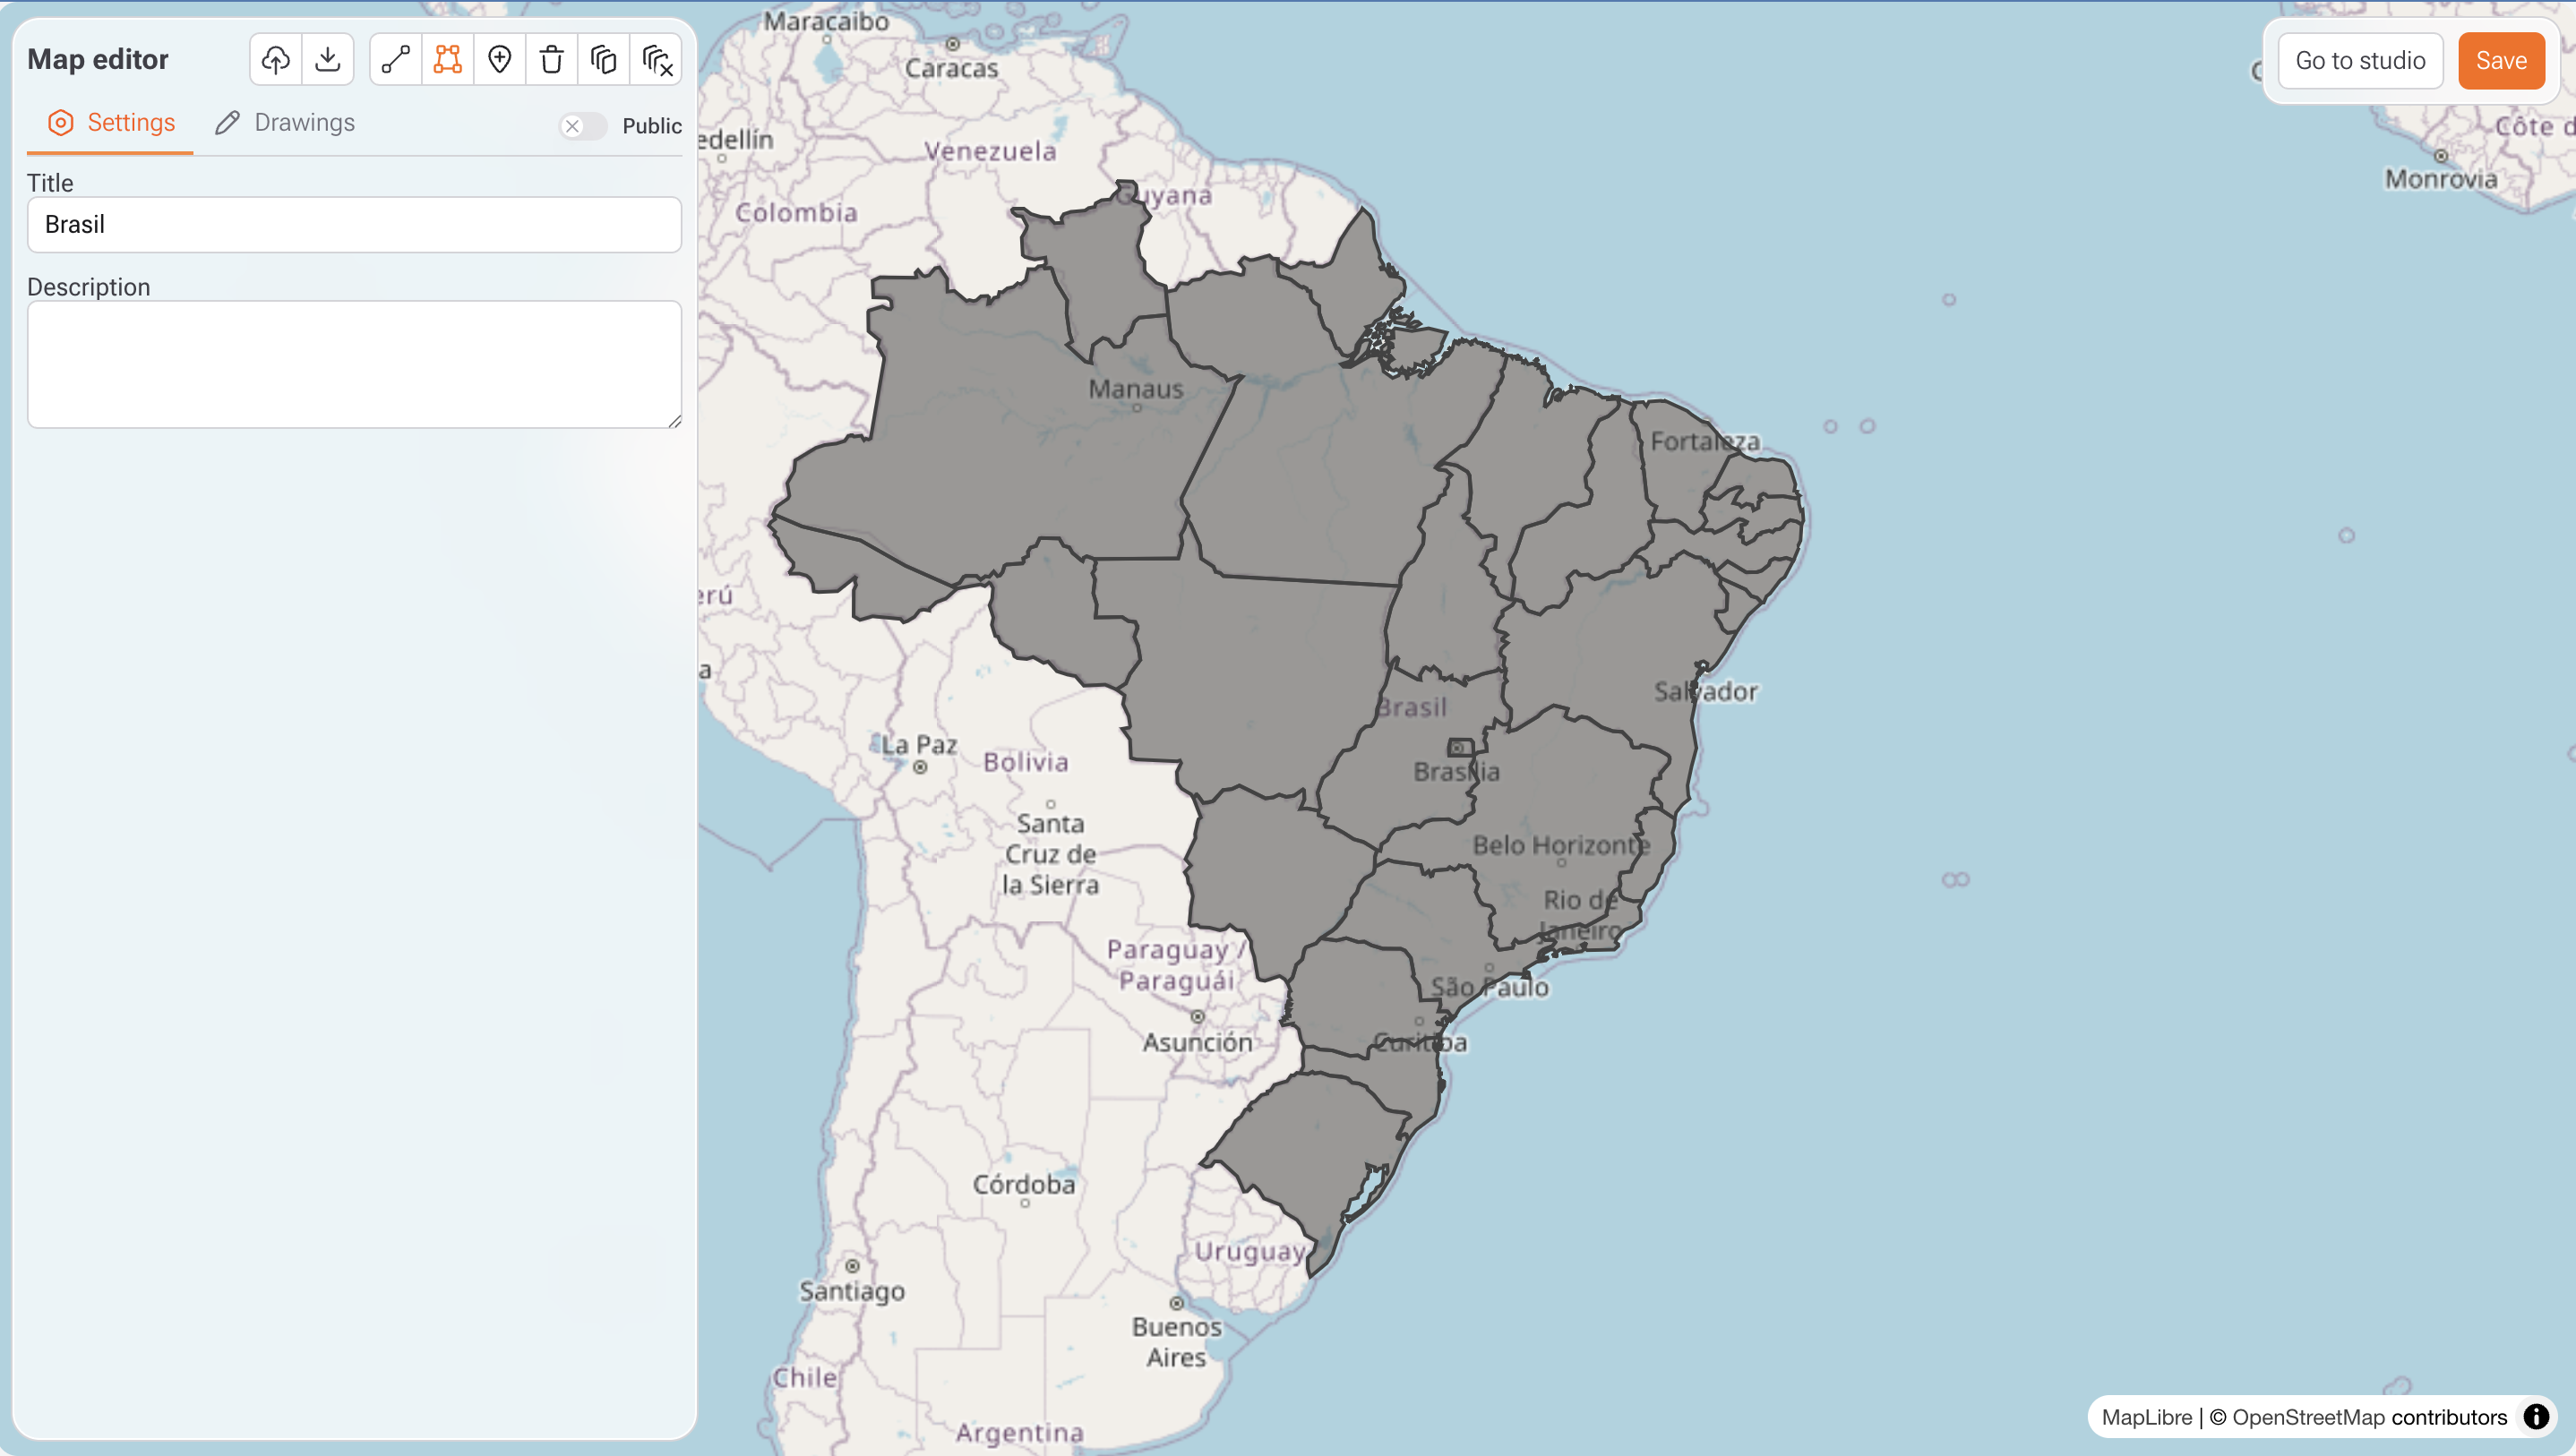
### **Maps**

* Allows users to build **custom geo maps** using **GeoJSON** files.
* Useful for geospatial visualizations and regional data insights.

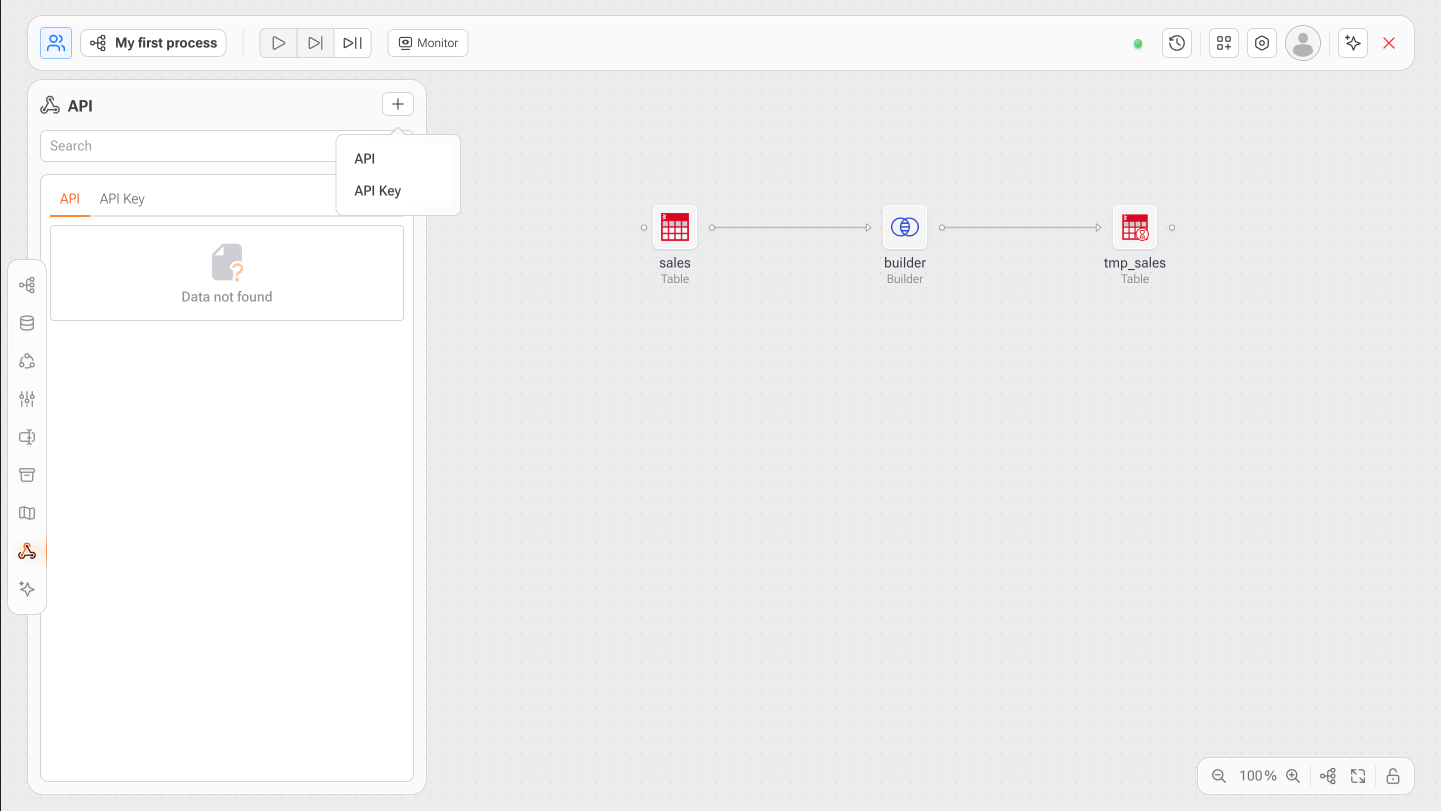
### **API**

* Enables users to **build and publish APIs** based on project-generated data.
* APIs can also be configured to **trigger data processes**, allowing real-time interaction with external systems.

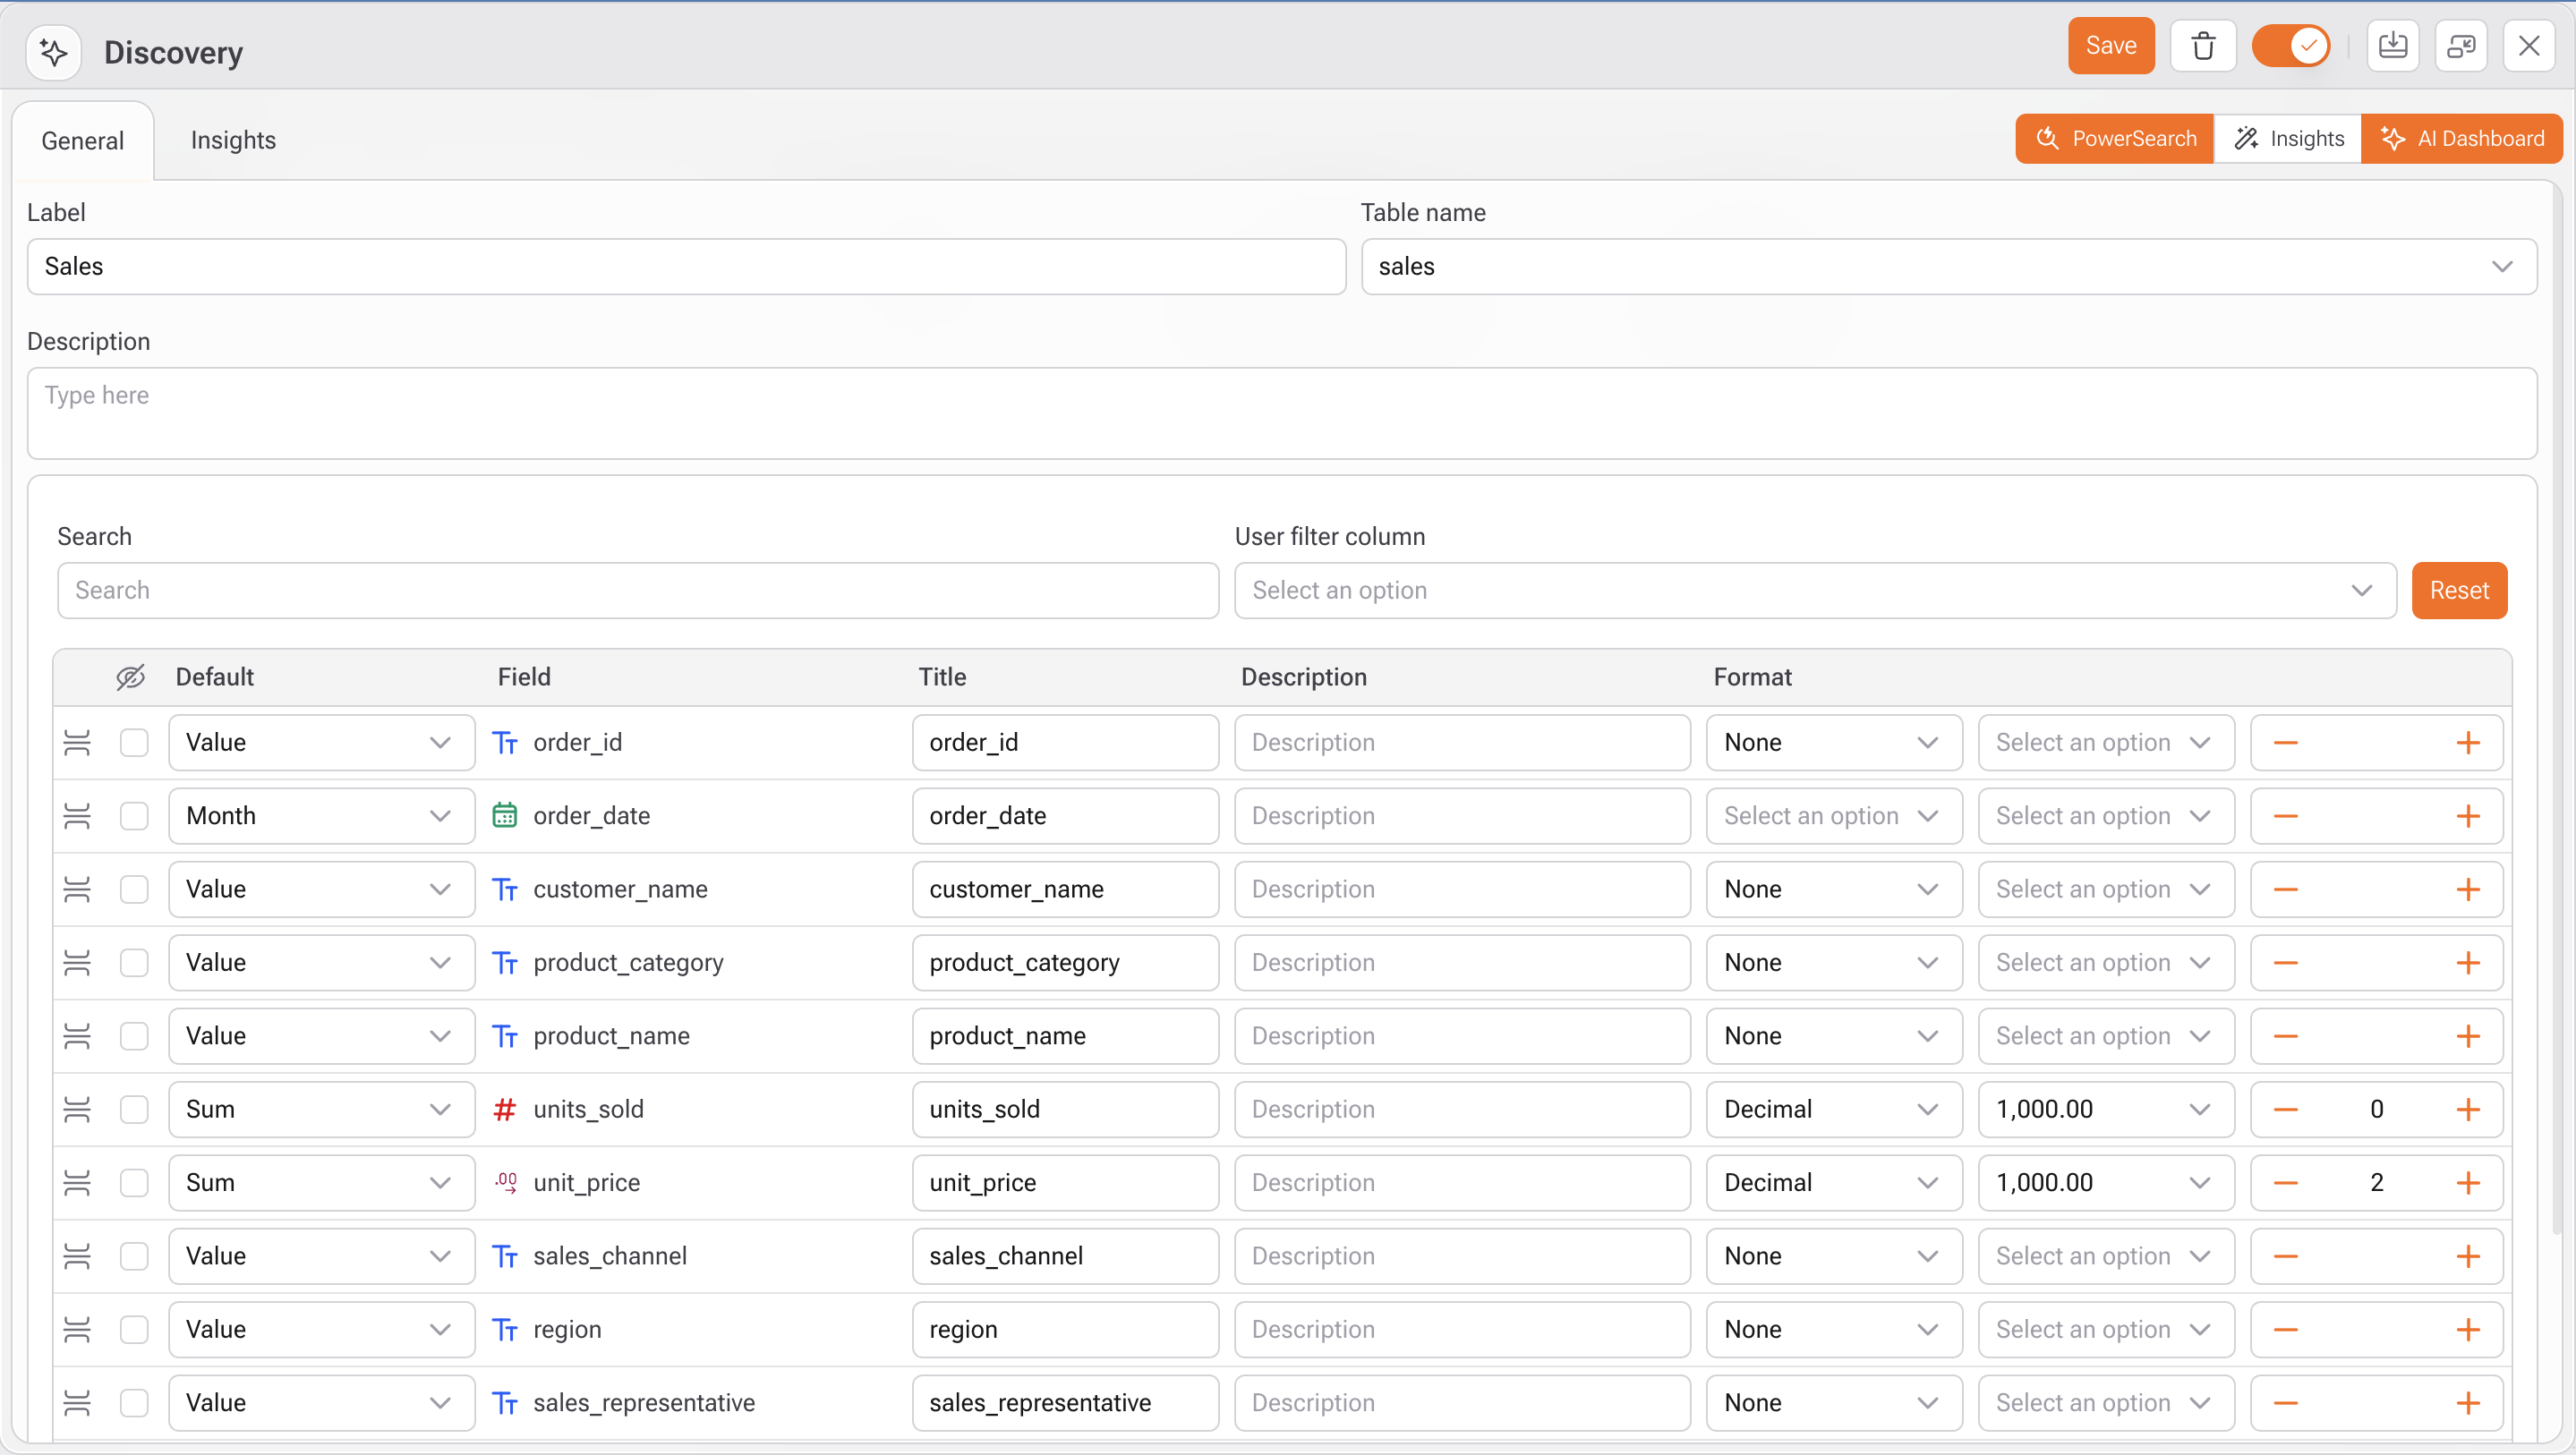
### **Discovery**

* A smart assistant for data exploration.
* Easily connect to a table and use:
  * **Power Search** (natural language search over data)
  * **AI Dashboard** (auto-generated visuals)
  * **Insights** (automated analysis and suggestions)


# Database

<figure><img src="/files/1VnxngD4cGhOCGdx50E8" alt=""><figcaption></figcaption></figure>

All data imported into **Gaio DataOS** is stored internally in a high-performance local database.\
Behind the scenes, Gaio uses the **ClickHouse** database engine to store, manage, and query data across your flows, dashboards, and APIs.

### What is ClickHouse?

[ClickHouse](https://clickhouse.com/) is a **column-oriented database management system (DBMS)** designed for **real-time analytical processing (OLAP)**. It was built to deliver **lightning-fast queries** on **massive volumes of data**, making it ideal for modern data platforms like Gaio.

***

### Benefits of ClickHouse in Gaio

| Feature                       | Description                                                                                                       |
| ----------------------------- | ----------------------------------------------------------------------------------------------------------------- |
| **Blazing-fast performance**  | ClickHouse is optimized for analytical queries and can process billions of rows per second on commodity hardware. |
| **Columnar storage**          | Stores data by columns instead of rows, reducing disk I/O and improving query speed dramatically.                 |
| **Real-time analytics**       | Supports real-time data ingestion and instant query execution — perfect for dashboards and live monitoring.       |
| **Efficient compression**     | Automatically compresses data, reducing storage footprint while preserving performance.                           |
| **Scalability**               | Easily scales horizontally with distributed architecture — useful for enterprise-scale workloads.                 |
| **SQL-compatible**            | Uses familiar SQL syntax, making it accessible for analysts, engineers, and data scientists.                      |
| **Fault-tolerant & reliable** | Includes support for replication, backup, and high availability across nodes.                                     |

***

#### How It Works in Gaio

* When data is uploaded or ingested into a **Data Project**, it is stored in your project’s isolated **ClickHouse schema**.
* All **flows**, **dashboards**, and **AI features** run queries directly on top of ClickHouse, ensuring high performance without additional infrastructure.
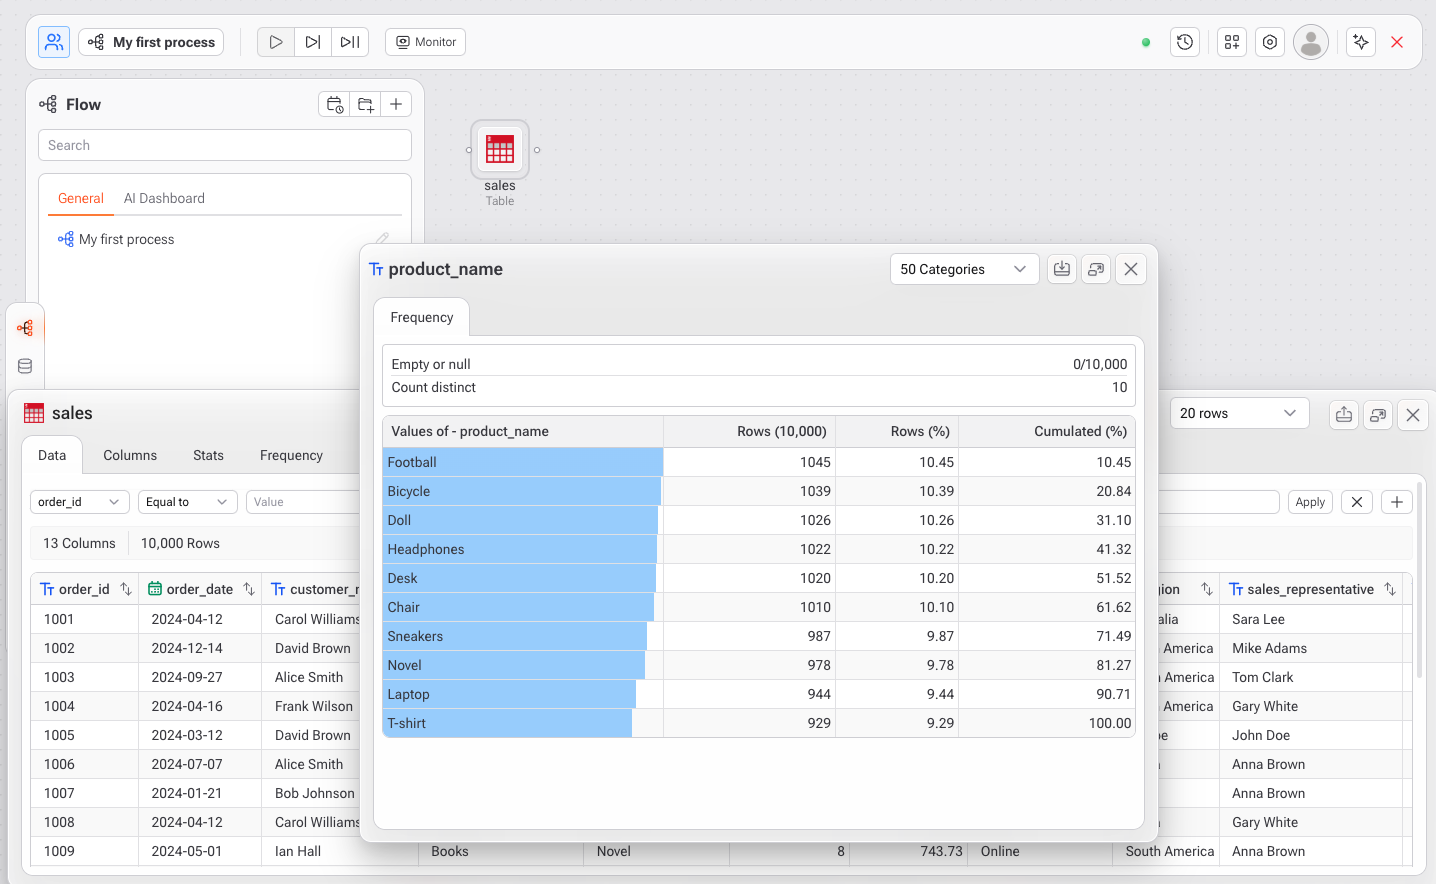
* Every action, from filtering a table to exploring data distributions (as shown in the image above), is powered by ClickHouse’s real-time query engine.

### Performance Benchmarks: ClickHouse vs Other Databases

ClickHouse consistently outperforms traditional and cloud-native databases in OLAP scenarios. Below is a comparison of query performance based on public benchmarks and real-world use cases.

> **Note:** Benchmarks may vary depending on infrastructure, dataset size, and query complexity. The table below reflects averages from public sources like ClickBench, Altinity, and independent performance tests.

| Database       | Type             | Query Latency (on 1B rows)  | Data Compression Ratio | OLAP Optimization | Real-Time Capabilities |
| -------------- | ---------------- | --------------------------- | ---------------------- | ----------------- | ---------------------- |
| **ClickHouse** | Columnar, OLAP   | **<1 second**               | **3–8x**               | ✅ **Yes**         | ✅ **Yes**              |
| PostgreSQL     | Row-based, OLTP  | \~30–60 seconds             | 1–2x                   | ❌ No              | ❌ Limited              |
| BigQuery       | Serverless OLAP  | \~3–10 seconds (cold start) | 2–4x                   | ✅ Yes             | ❌ No (batch-based)     |
| Redshift       | Columnar, OLAP   | \~5–15 seconds              | 2–4x                   | ✅ Yes             | ❌ No (cached)          |
| Snowflake      | Cloud-based OLAP | \~5–20 seconds              | 3–6x                   | ✅ Yes             | ❌ No (batch)           |
| MySQL          | Row-based, OLTP  | \~50–120 seconds            | \~1x                   | ❌ No              | ❌ No                   |

#### Why Gaio Chose ClickHouse

Gaio DataOS was designed for **speed, flexibility, and scalability**. ClickHouse was the natural choice for the following reasons:

* It's **open-source**, robust, and proven in production at scale (used by Yandex, Cloudflare, and others).
* It allows Gaio to deliver **low-latency queries** across huge datasets with **minimal resource overhead**.
* Its **native SQL support**, **built-in compression**, and **distributed architecture** perfectly match Gaio's mission: **democratizing enterprise analytics without compromising on performance**.


# Workflow

<figure><img src="/files/ibJkIbXV5NrK2YEjcvbR" alt=""><figcaption></figcaption></figure>

### Data Flows in Gaio DataOS

**Data Flows** are the foundation of how data is transformed, automated, and operationalized within Gaio DataOS. They represent visual pipelines that combine multiple steps into a seamless, executable logic — from raw data ingestion to business-ready insights.

***

### What Can a Data Flow Contain?

Each flow can include a wide range of components that address real-world business problems and enable scalable data solutions:

* **SQL Queries**:\
  Run advanced queries to transform, join, and aggregate data directly from the ClickHouse engine.
* **Auto Machine Learning**:\
  Incorporate no-code or low-code machine learning models to predict trends, classify events, and detect anomalies.
* **API Connections**:\
  Integrate external data sources or trigger APIs to automate system actions or expose your data as a service.
* **Dashboards and Reports**:\
  Generate visual reports such as charts, KPIs, heatmaps, and tables — all linked directly to your data logic.
* **Content Elements**:\
  Add banners, cards, or textual explanations to enhance the storytelling in your dashboards.

***

### Automation Capabilities

Flows in Gaio can be fully automated using scheduled triggers or external events:

* **Scheduled Execution**: Set recurring intervals (hourly, daily, weekly, etc.)
* **Manual Execution**: Trigger flows on demand for ad-hoc analysis or debugging
* **Triggered by API/Form**: Launch flows when users interact with dashboards or when APIs are called

***

#### Benefits

| Feature                    | Description                                                                                        |
| -------------------------- | -------------------------------------------------------------------------------------------------- |
| **Visual Design**          | Drag-and-drop blocks to build your logic without writing code (but code is supported when needed). |
| **Modular Structure**      | Each block (SQL, report, model, etc.) can be reused in different flows or projects.                |
| **Live Monitoring**        | Track execution status in real time with built-in logging and performance metrics.                 |
| **End-to-End Integration** | Combine data prep, ML, and visualization in one single flow — no switching between tools.          |


# Data Sources

### Data Sources in Gaio DataOS

**Gaio DataOS** was designed to integrate and transform data from multiple sources — from traditional databases to modern cloud-based services.\
This flexibility allows organizations of all sizes to centralize their information in a single environment for analysis and automation.

***

### Direct Database Connections

Gaio easily connects to a wide variety of database management systems (DBMS), enabling real-time operations, automations, complex queries, and intelligent data pipelines.

**Supported databases:**

* MySQL
* PostgreSQL
* ClickHouse
* SQL Server
* MariaDB
* MemSQL
* Amazon Redshift
* Snowflake
* Oracle
* Databricks
* Salesforce

These connections provide direct access to tables, which can be queried using SQL, visualized in dashboards, or used as the foundation for transformation flows and machine learning models.

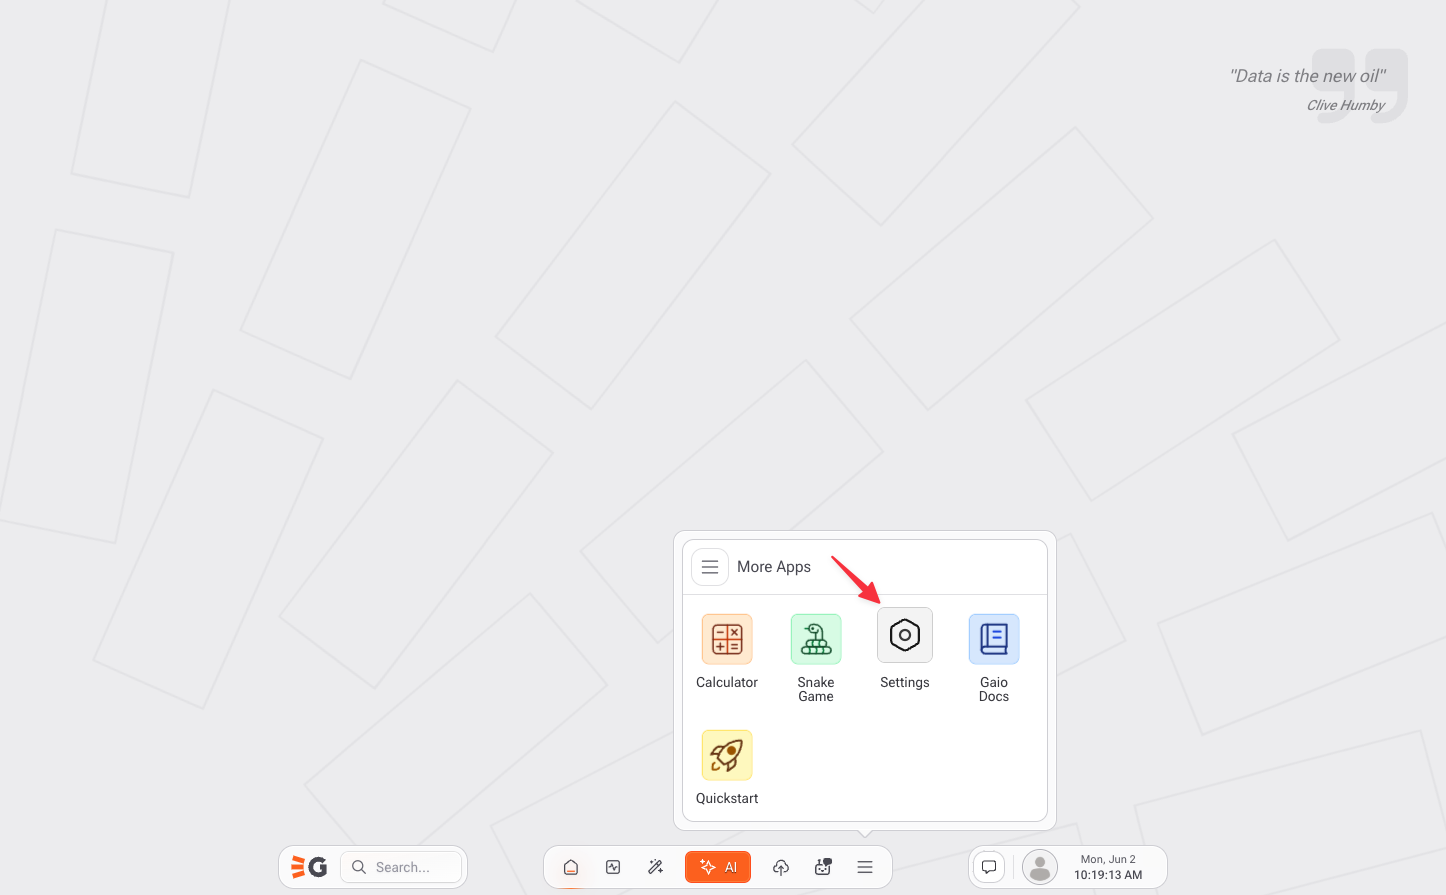
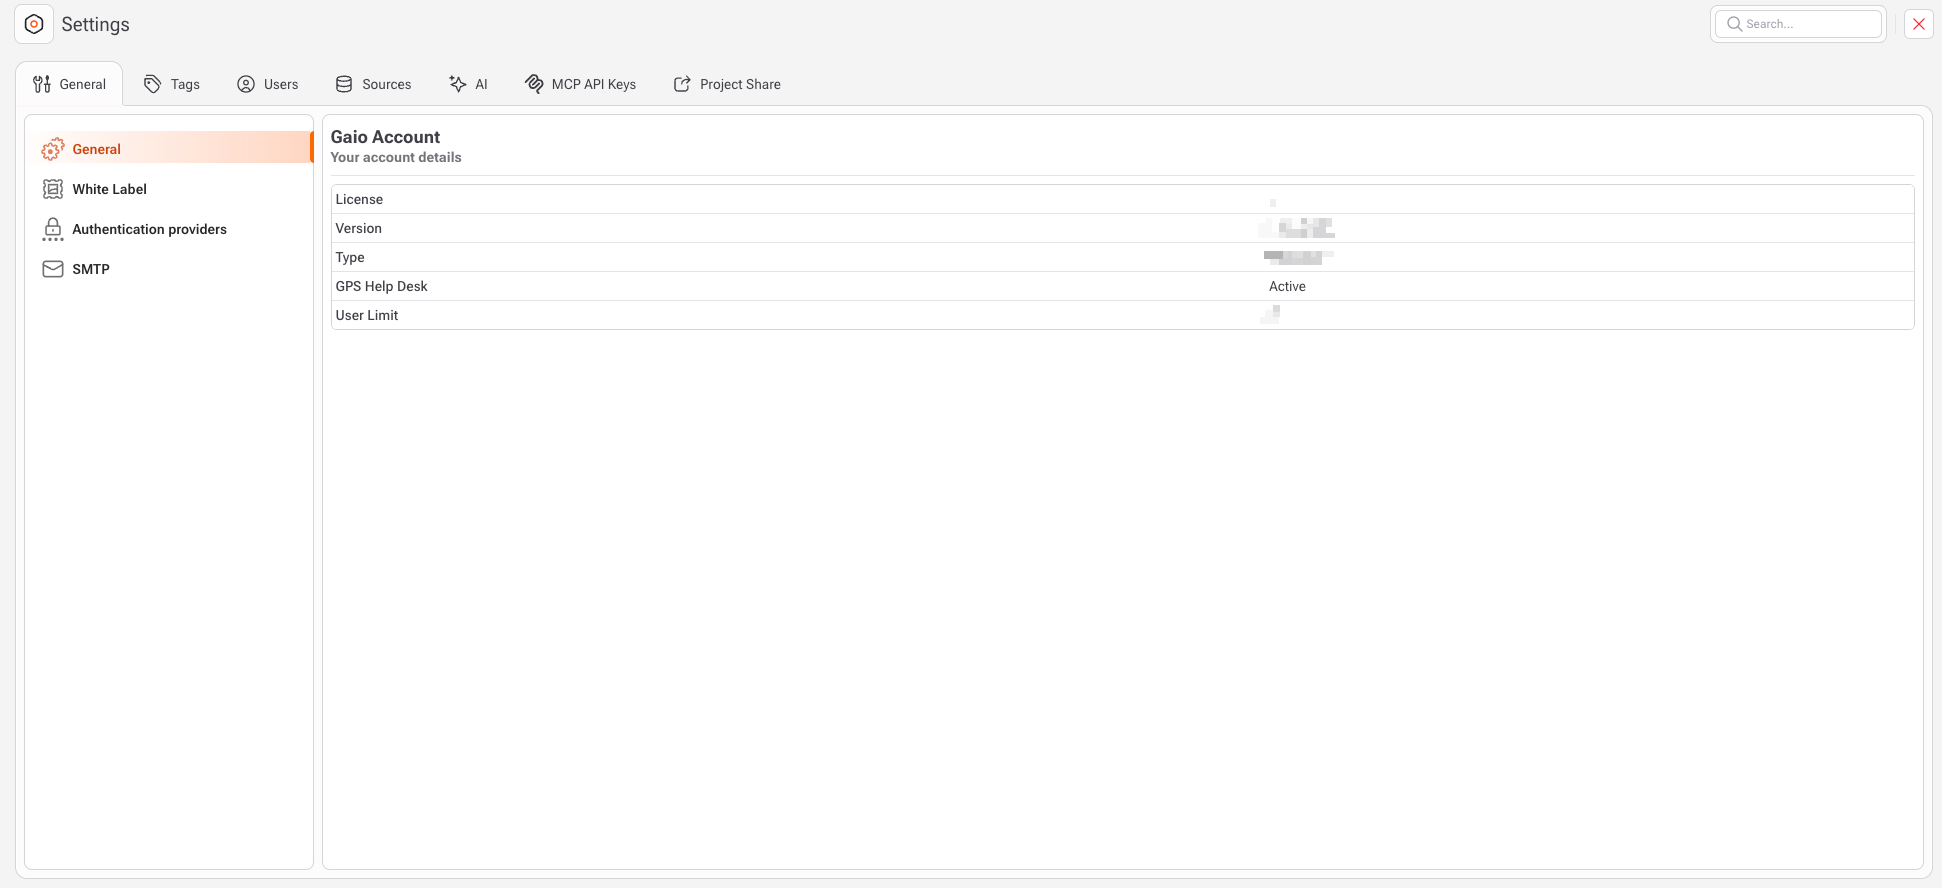
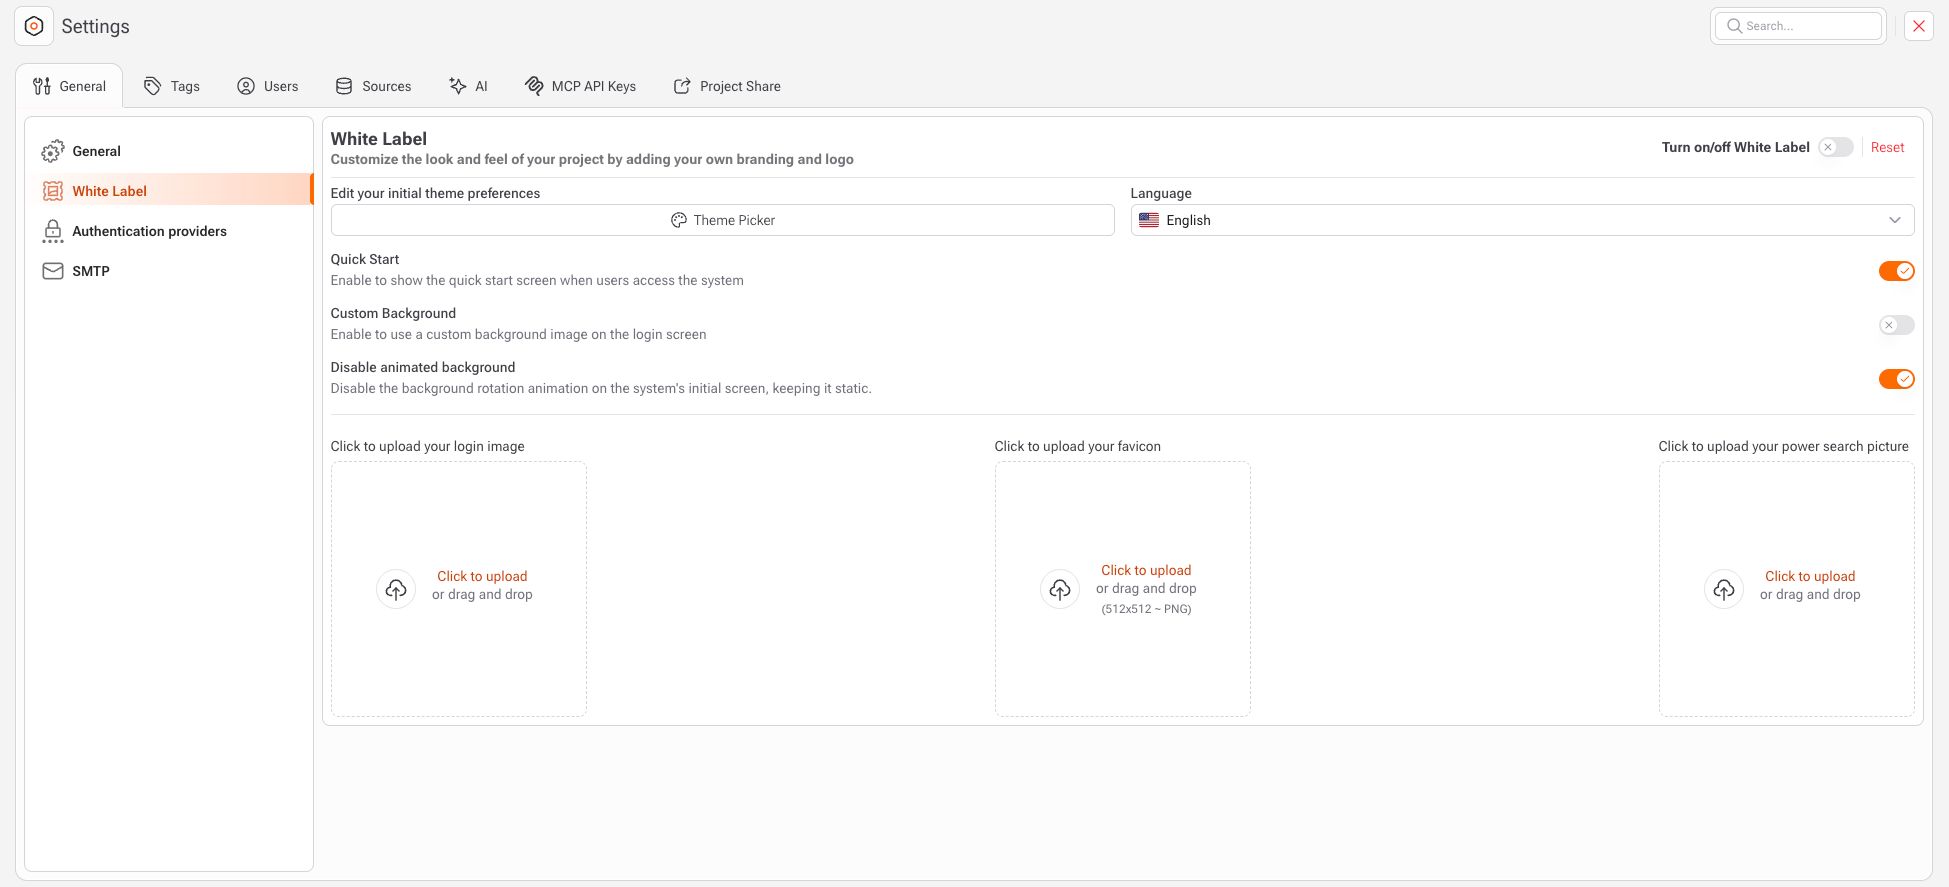
<figure><img src="/files/3ejFfucpUyFmEx1RpxiU" alt=""><figcaption><p>Access to Settings</p></figcaption></figure>

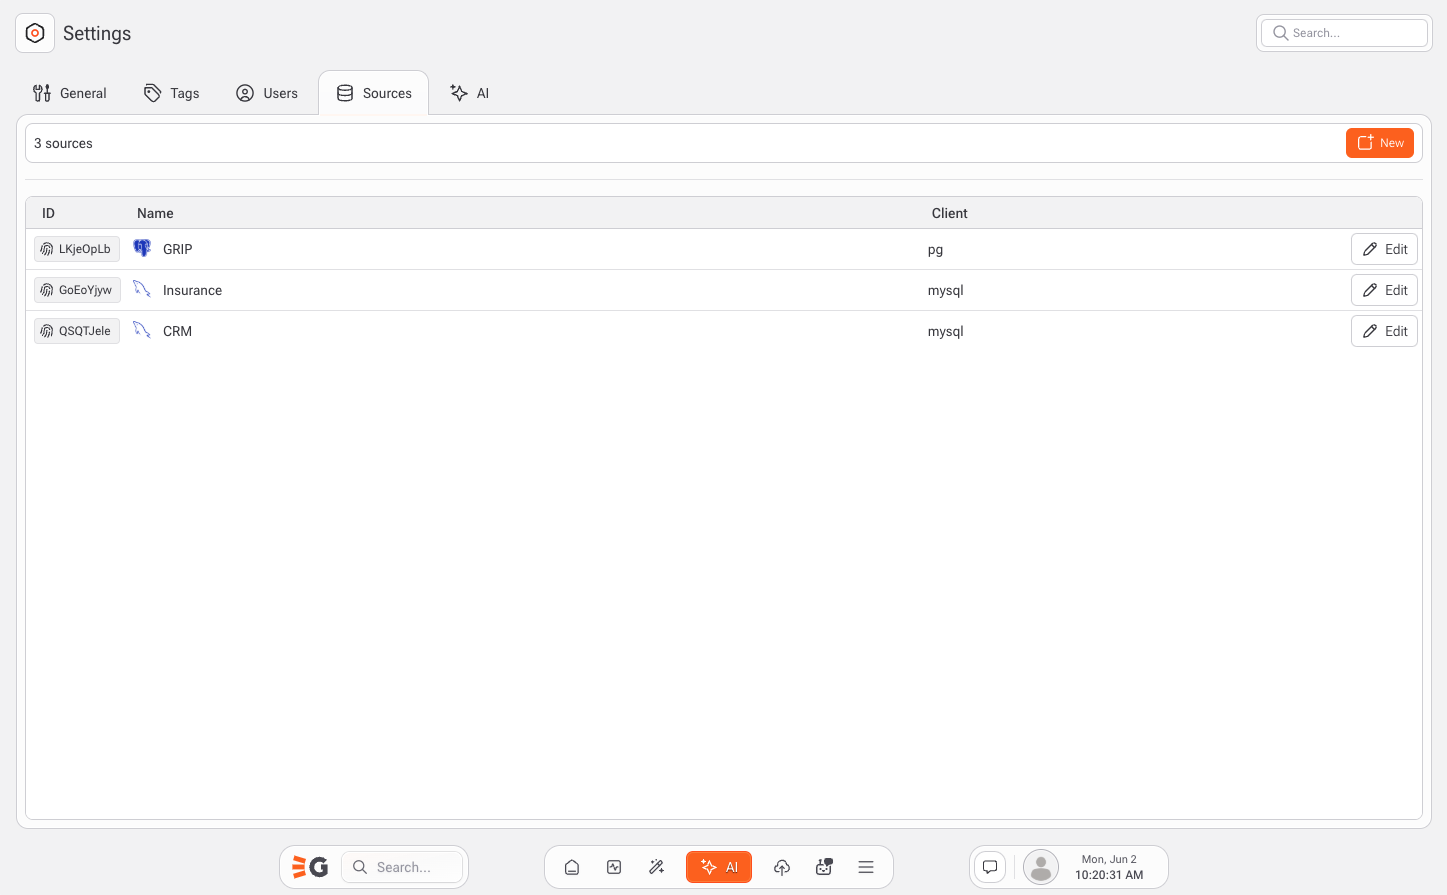
<figure><img src="/files/JTm1B8gpc18kfl002pJl" alt=""><figcaption><p>Settings Page</p></figcaption></figure>

***

### API Connections via REST

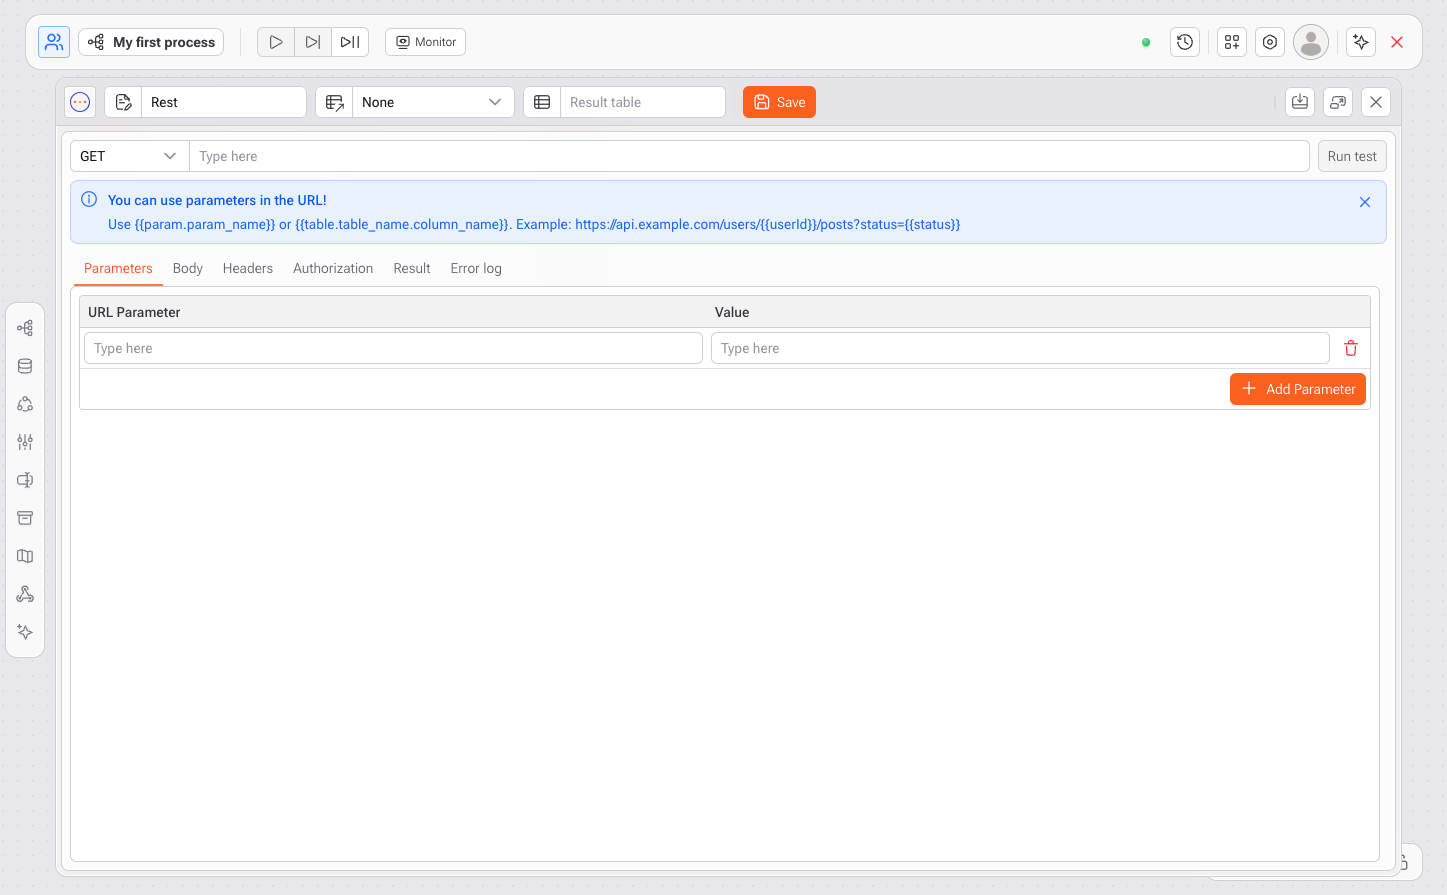
In addition to database connections, Gaio offers a powerful task called **REST**, which allows integration with external data through APIs.

With this feature, you can:

* Connect to enterprise services like **Hubspot**, **ERPs**, and **CRMs**
* Retrieve data from **public or internal APIs**
* Build **automated pipelines** from JSON responses
* Send **dynamic parameters** and configure headers, tokens, and authentication

This makes Gaio a true **integration hub**, capable of receiving and processing data from virtually any API-enabled source.

<figure><img src="/files/P2mU87DUJD3jiWq63XJN" alt=""><figcaption><p>REST</p></figcaption></figure>

***

### Cloud Storage Integrations

Gaio also supports connecting to cloud storage systems, allowing users to work directly with files and objects stored in:

* Amazon S3
* Azure Blob
* Google Drive *(via REST)*
* Google Sheets *(via native Studio feature)*

***

### Why This Matters

Having multiple integration options makes Gaio ideal for:

* Unifying data scattered across different systems
* Automating real-time data updates
* Building **Business Intelligence** and **Machine Learning** solutions based on consistent, up-to-date data
* Reducing dependency on external ETL or integration tools

> At its core, **Gaio DataOS** is a **connected environment**, ready to integrate with your entire data ecosystem — whether through databases, cloud storage, or APIs.


# Flow

<figure><img src="/files/e2ZTwgu9GSADjeZEfaYV" alt=""><figcaption></figcaption></figure>

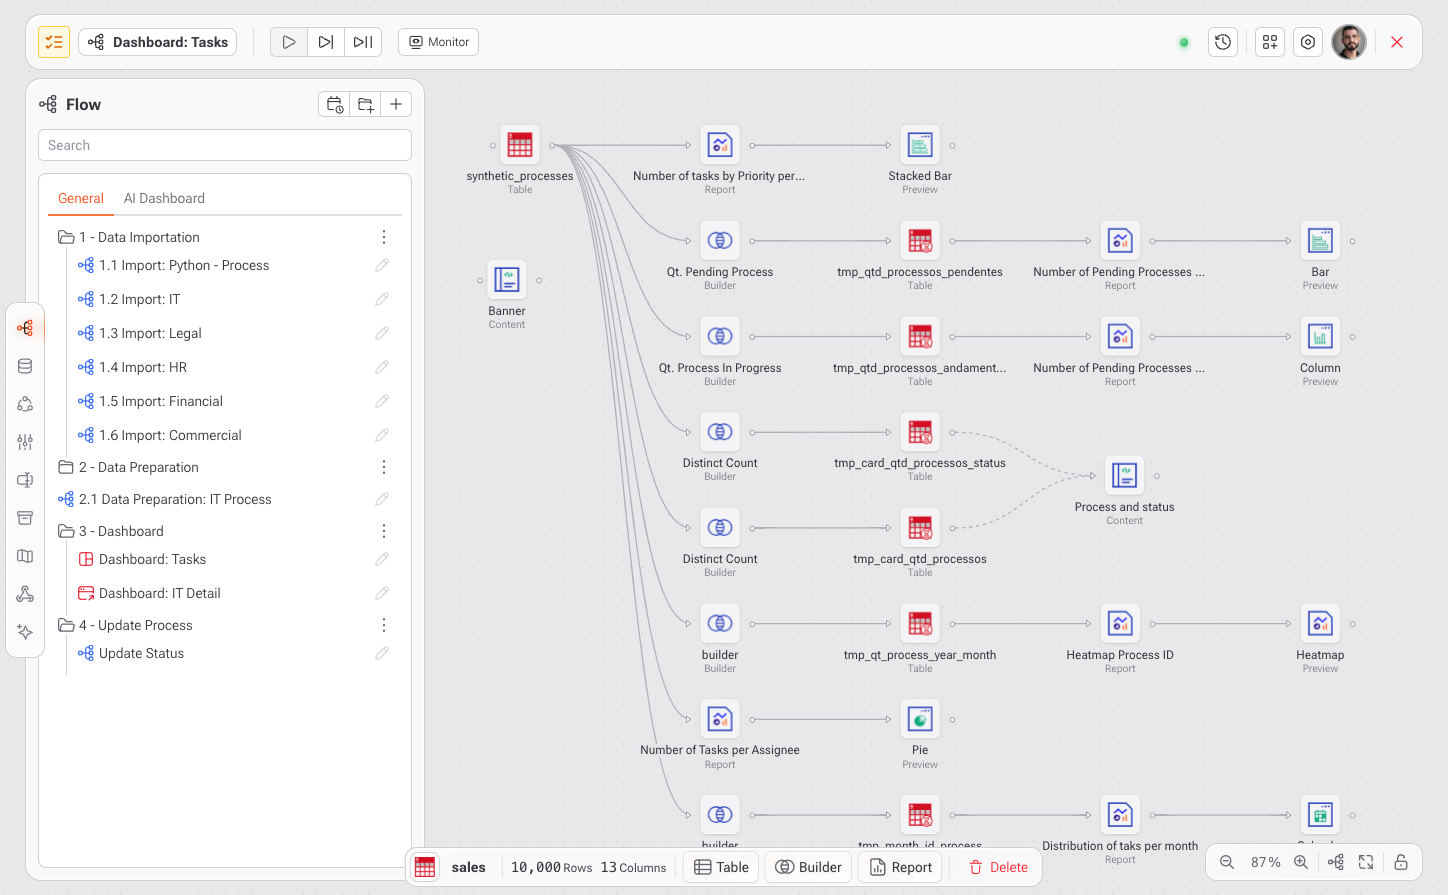
**Flow** is the visual environment in Gaio Studio designed to **create data pipelines**. It allows you to connect tasks and transform data in a modular, agile, and collaborative way. It's ideal for ETL processes, automated analytics, machine learning, reports, and data delivery.

***

#### &#x20;Purpose of the Flow

To build complete workflows by organizing data processing, analysis, and delivery steps in a connected, visual format.

***

## &#x20;How to Use Flow

### **1. Access the Flow Section**

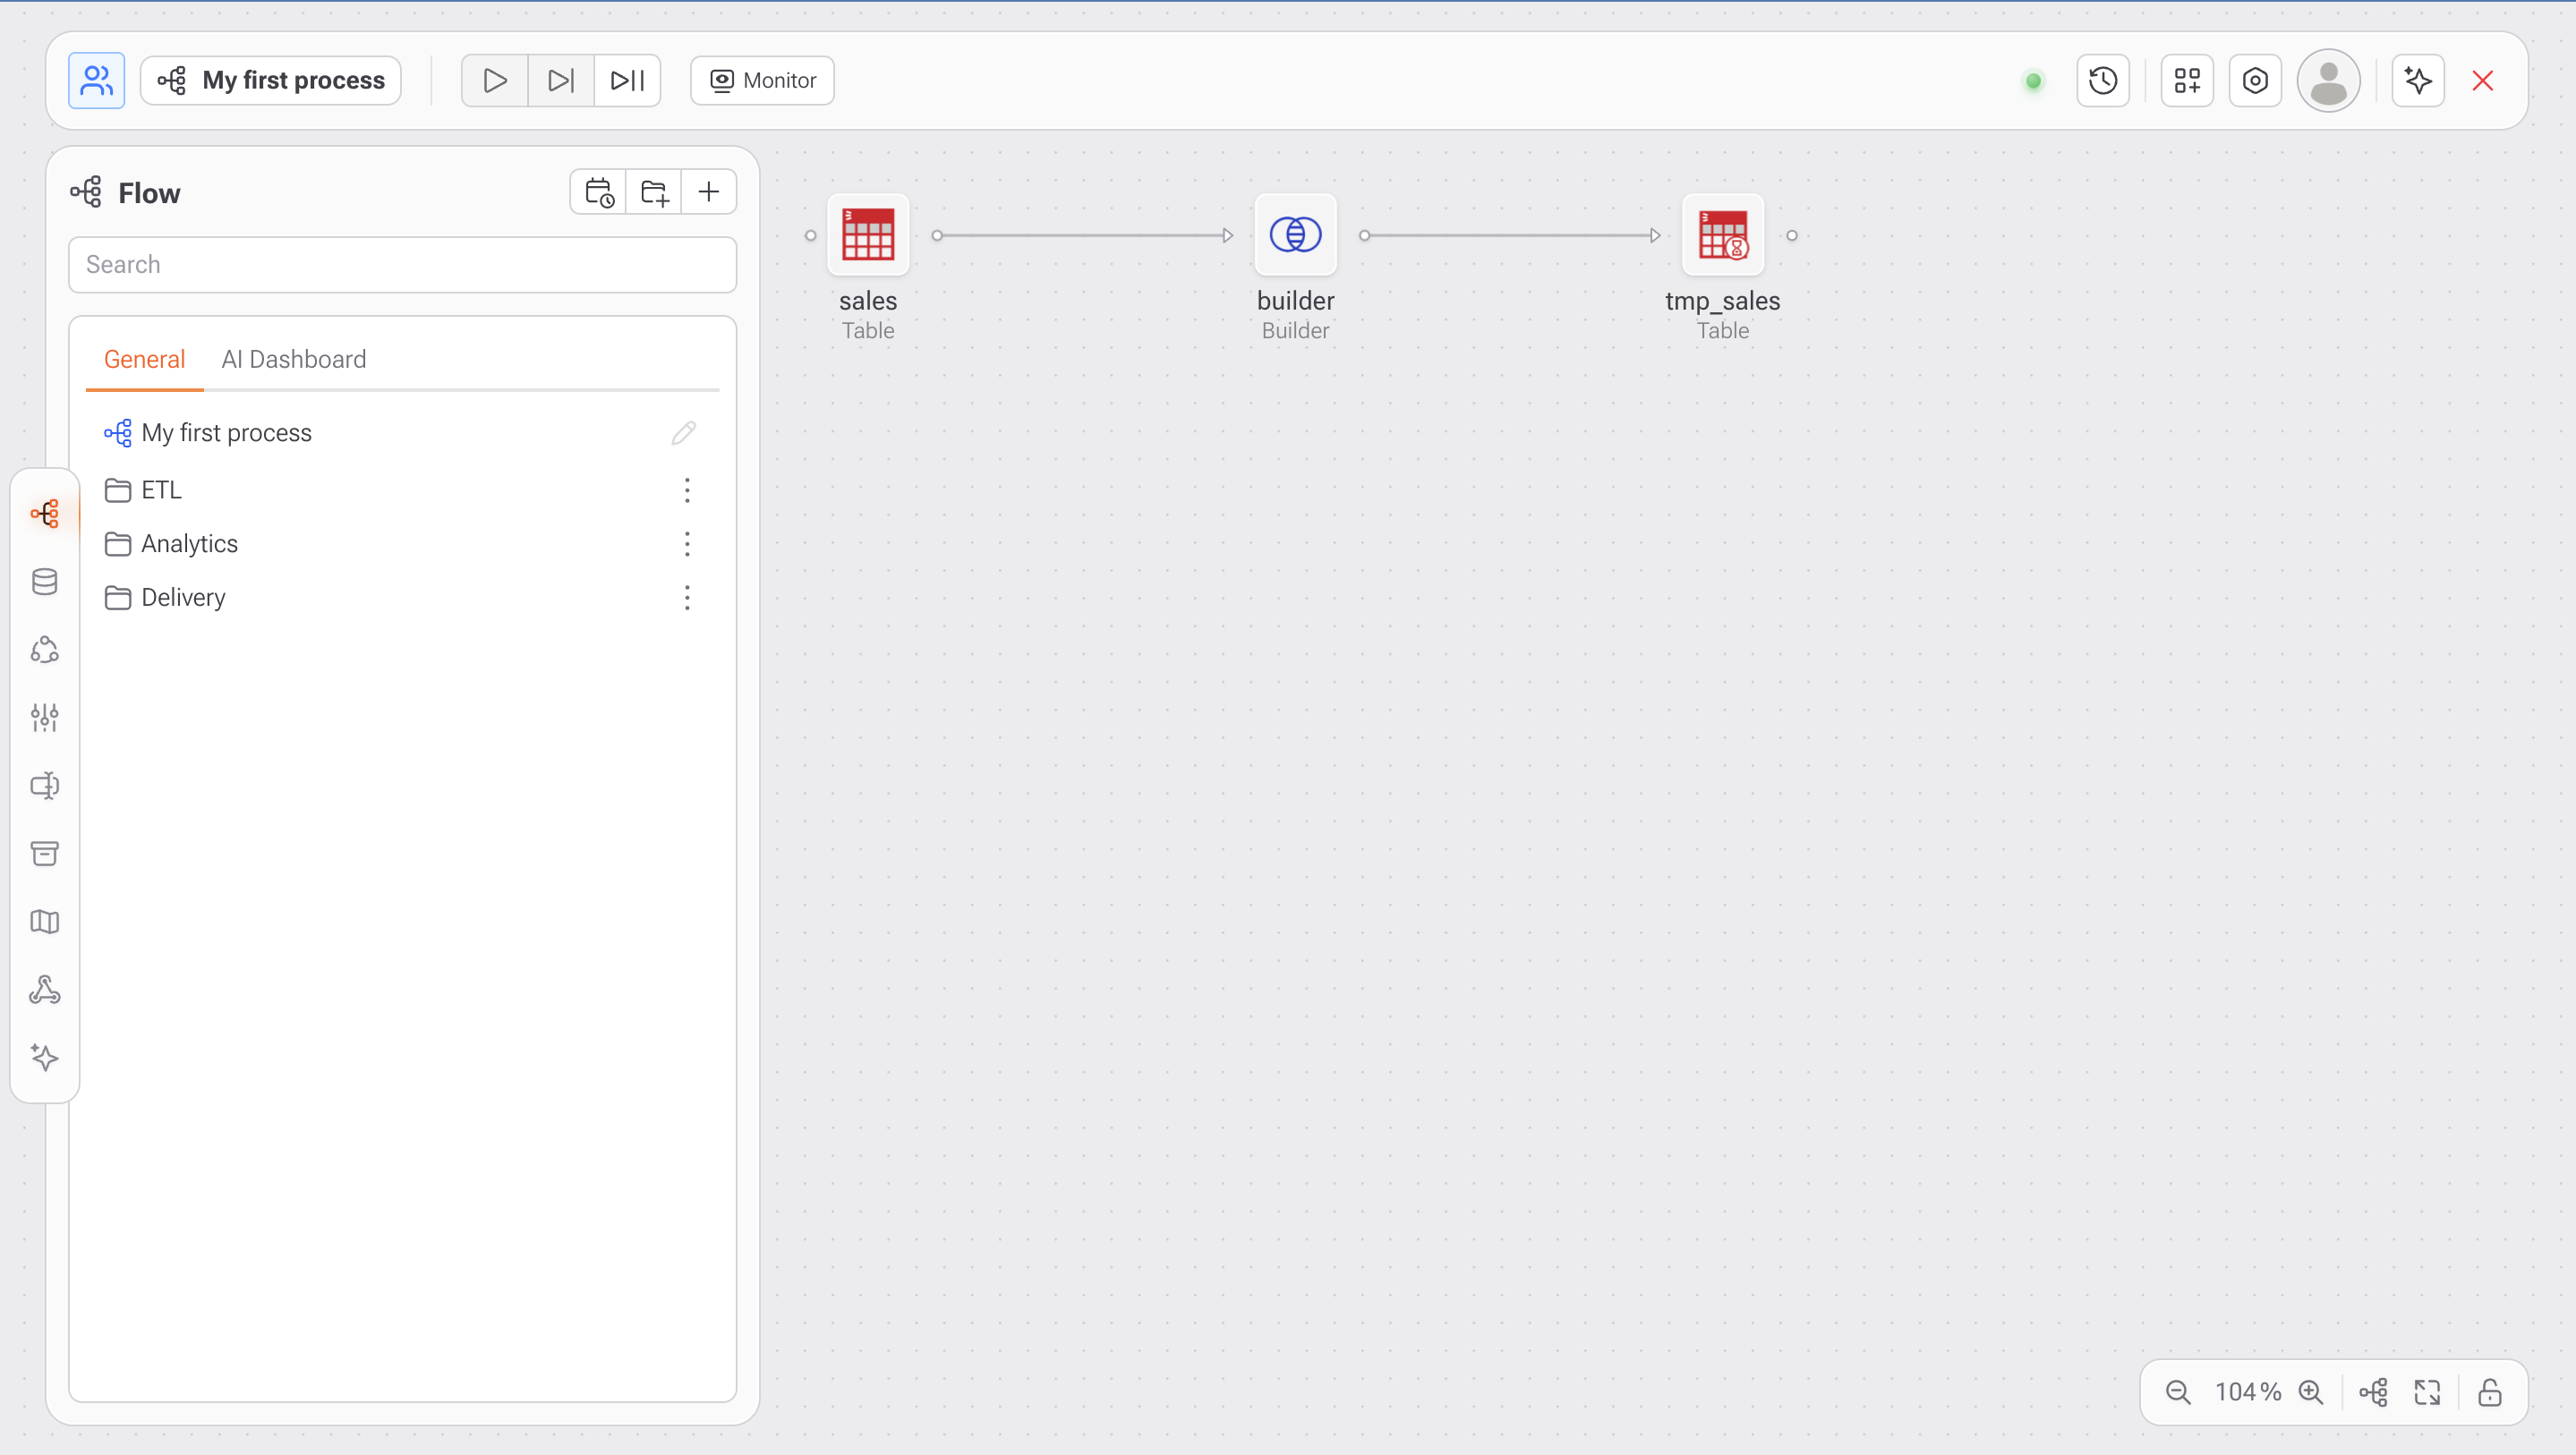
* Click the **Flow** icon on the left sidebar.
* You'll see the canvas with the name of the current process (e.g., *My first process*).
* The left panel displays folders for organization. Example: **ETL**, **Analytics**, and **Delivery**.

***

### **2. Create or Select a Process**

* Click the `+` button in the top corner of the panel to create a new process.
* Name the process and begin adding blocks as needed.

***

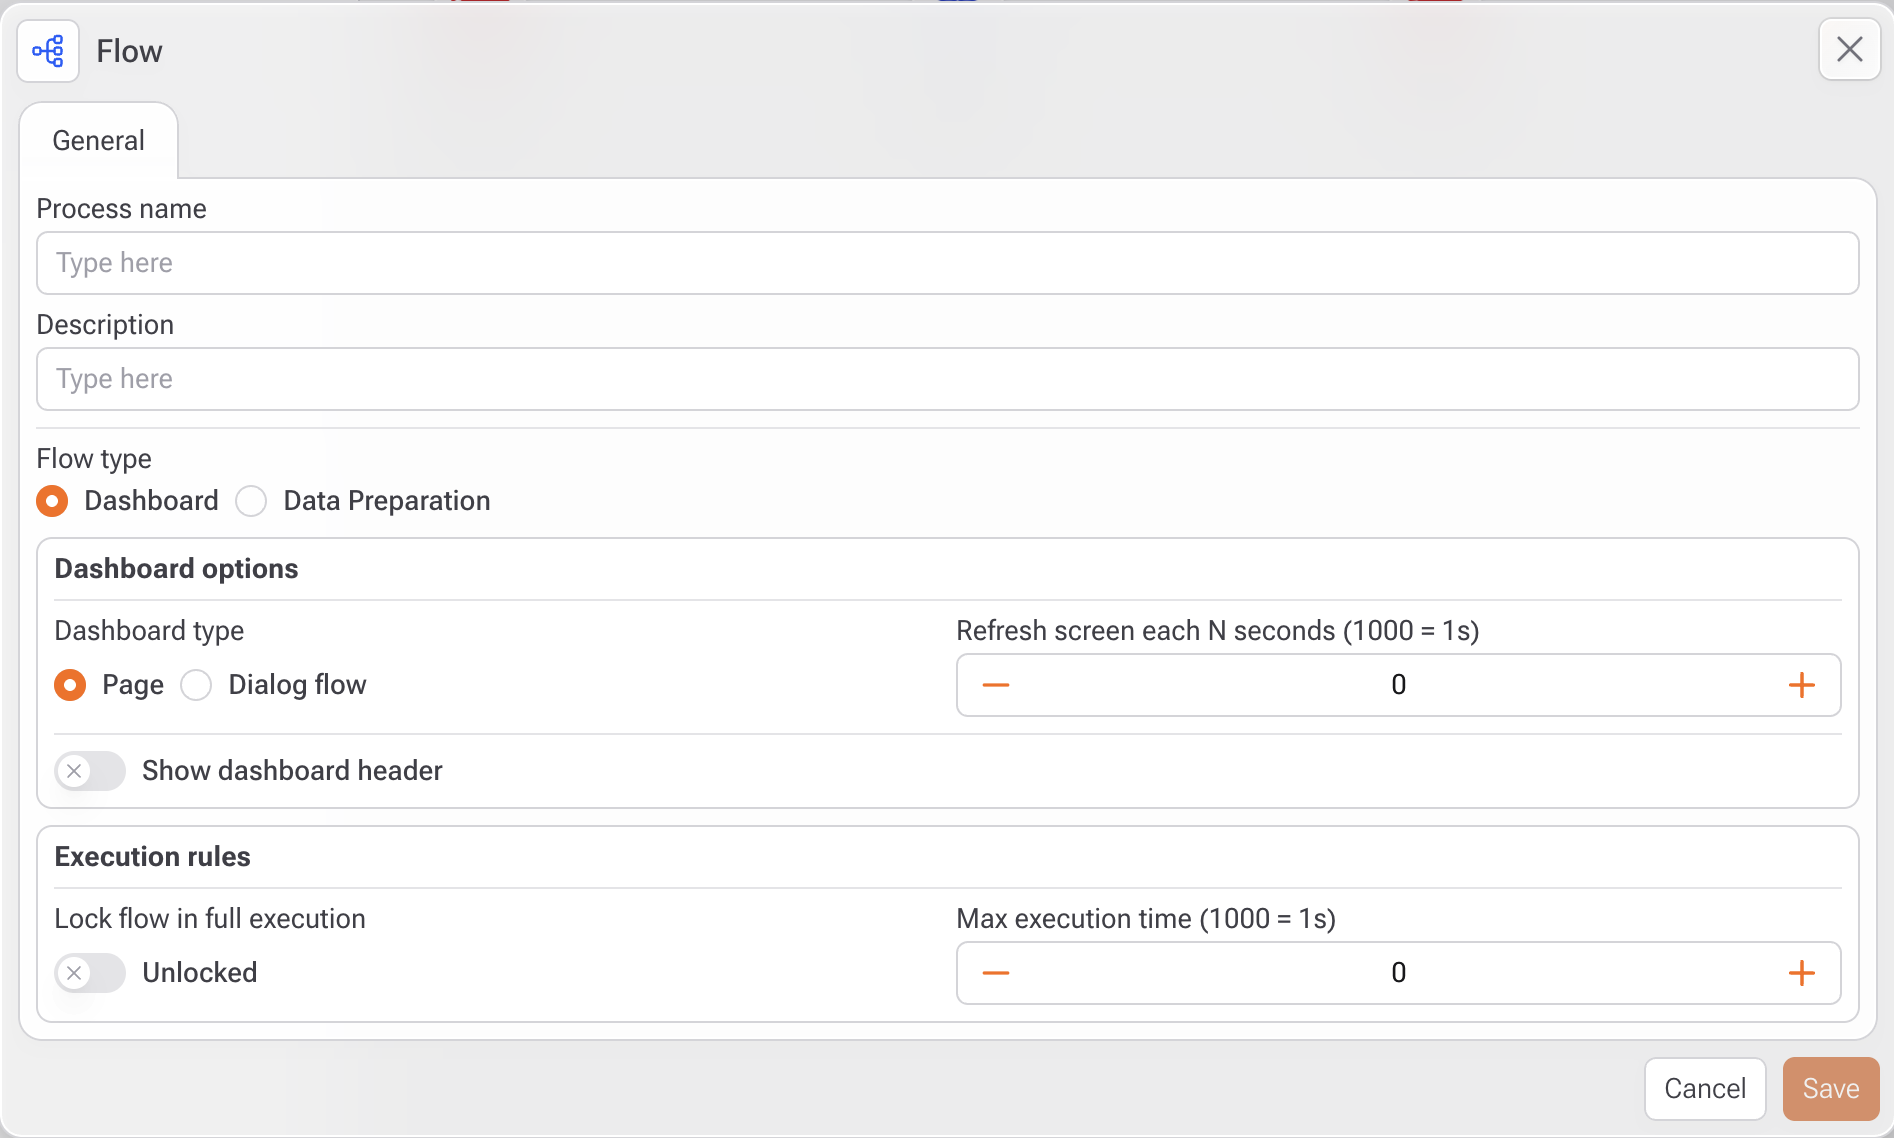
### 3. Step-by-Step: Flow Setup

<figure><img src="/files/vt9i0Y5mAD9QDNSNkMoy" alt=""><figcaption></figcaption></figure>

1. **Process Name**

* Enter a clear and descriptive name for your process (e.g., `Sales_ETL_Flow` or `CustomerDashboard`).
* This name will appear in the Flow workspace and sidebar.

2. **Description**

* (Optional) Provide a brief summary of the flow’s purpose.
* Useful for documentation and collaboration across teams.

3. **Flow Type:**&#x20;

* **Data Preparation**:
  * Choose this option for backend flows focused on data transformation, loading, and modeling.
* **Dashboard**:
  * Use this if your flow will generate a visual dashboard for monitoring or user interaction.
  * &#x20;Dashboard Options (If “Dashboard” is selected)
    * **Dashboard Type**:
      * **Page**: Displays the dashboard as a full page.
      * **Dialog Flow**: Opens the dashboard inside a modal or dialog window.
  * **Show Dashboard Header**:
    * Enable or disable the header section of the dashboard.
    * Useful to provide titles or filters for the user.
  * **Refresh Screen Interval**:
    * Set the screen auto-refresh interval (in milliseconds).
    * Example: `1000` = 1 second; `60000` = 1 minute.
    * Use this for real-time monitoring dashboards.

4. **Execution Rules**

* &#x20; **Lock Flow During Execution**:
* **Max Execution Time**:
  * Define the maximum runtime allowed for this flow (in milliseconds).
  * Example: `300000` = 5 minutes.
  * Helps avoid indefinite executions or overloading the server.

***

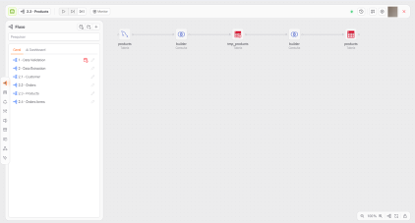
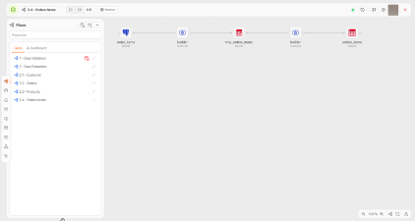
### **4. Drag and Connect Blocks**

* Drag tasks from the left menu (such as Table, Builder, Cluster, AutoML, etc.).
* Connect blocks by clicking the gray dot next to a block and dragging it to another.

***

### **5. Edit Each Block Individually**

* Click on the pencil icon any block to open its configuration window.
* Adjust table settings, SQL scripts, visualization parameters, or machine learning configurations.

***

### **6. Run the Process**

* Use the top bar buttons to:
  * Run: Start selected task
  * Run from here: Start running the flow from the selected task
  * Run all: Run the entire flow
* Click **Monitor** to track logs and execution performance in real-time.

***

#### &#x20;Best Practices

* Use clear and consistent naming for processes and tables (e.g., `tmp_sales_daily`).
* Keep your blocks organized visually on the canvas.
* Break large workflows into smaller thematic subflows.
* Add comments inside each block to document logic.


# Sources

<figure><img src="/files/14wRcomPcWfmcG0UinGX" alt=""><figcaption></figcaption></figure>

The **Sources** panel in Gaio DataOS provides developers with a centralized view of all data sources available within a project. This includes internal buckets, shared data from other applications, and external databases configured by administrators. It is a critical area for building complete and connected data flows.

***

### &#x20;1. Default Project Bucket

Every application in Gaio automatically has **its own data bucket**, which appears in the *Sources* panel. This bucket contains **all tables created within the current project** and is the primary workspace for managing and transforming data locally.

***

### &#x20;2. Accessing Buckets from Other Projects

<figure><img src="/files/UA3NN8LU0eubfX13P268" alt=""><figcaption></figcaption></figure>

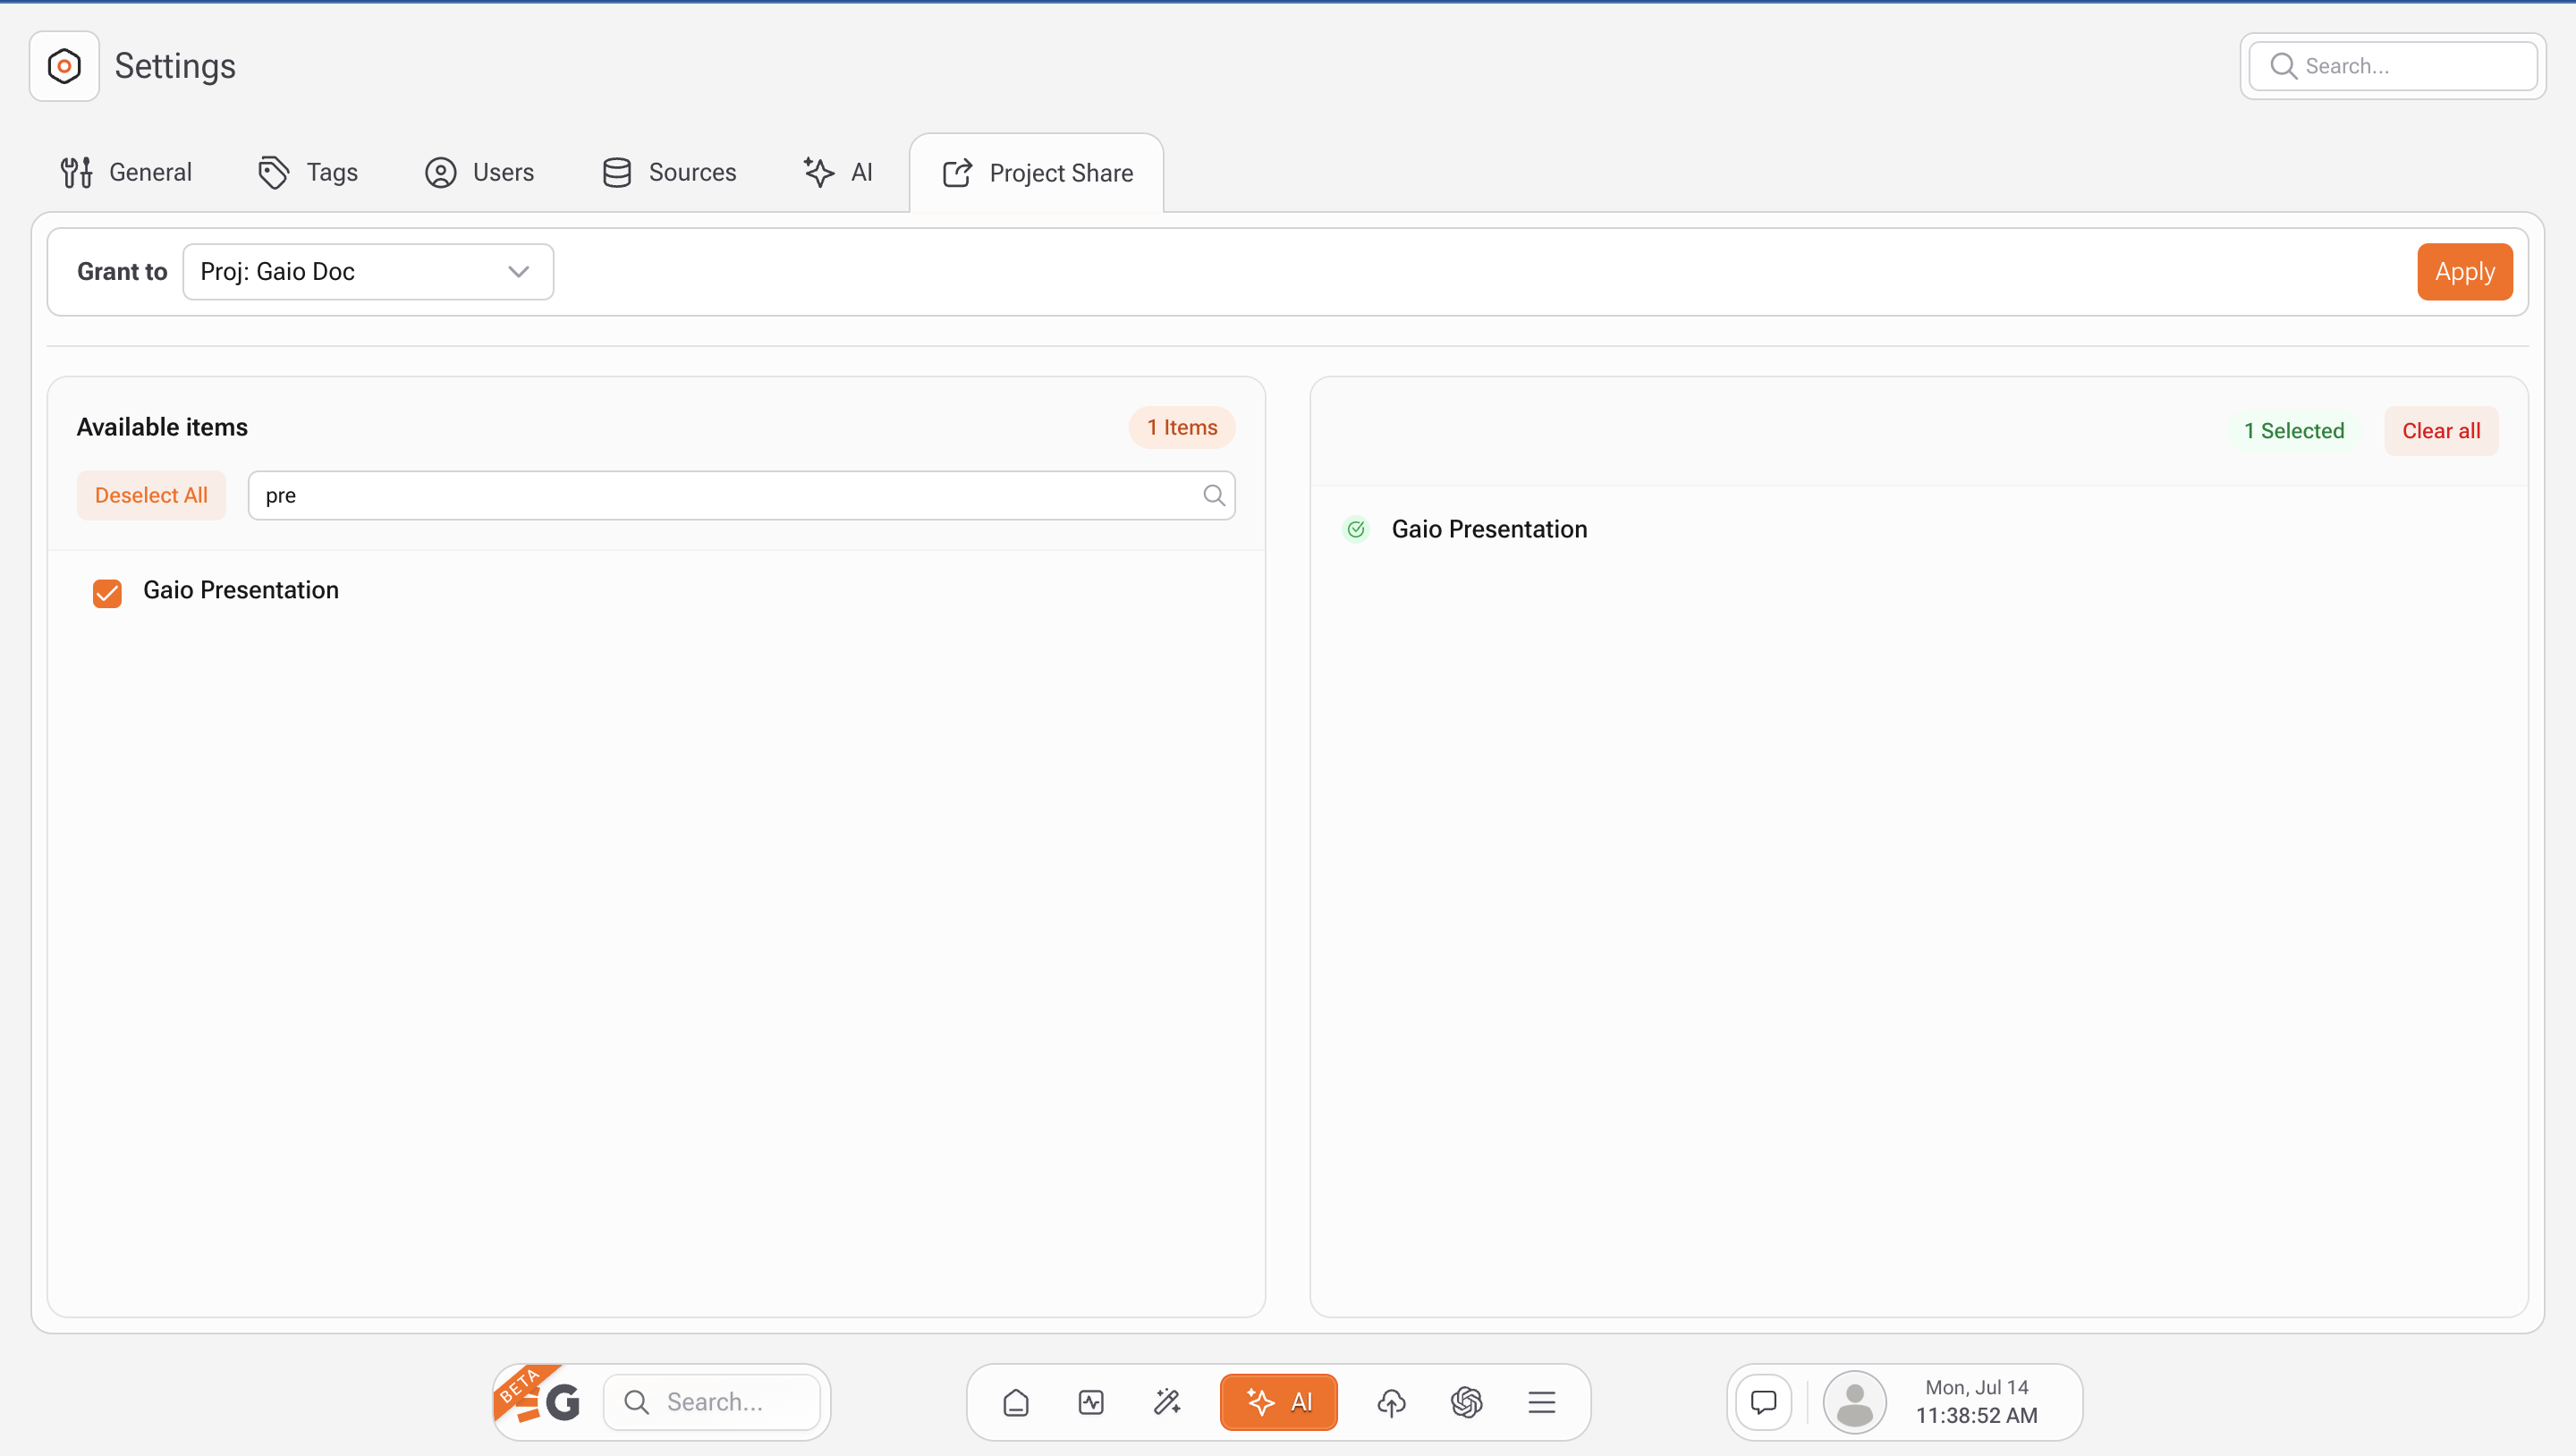
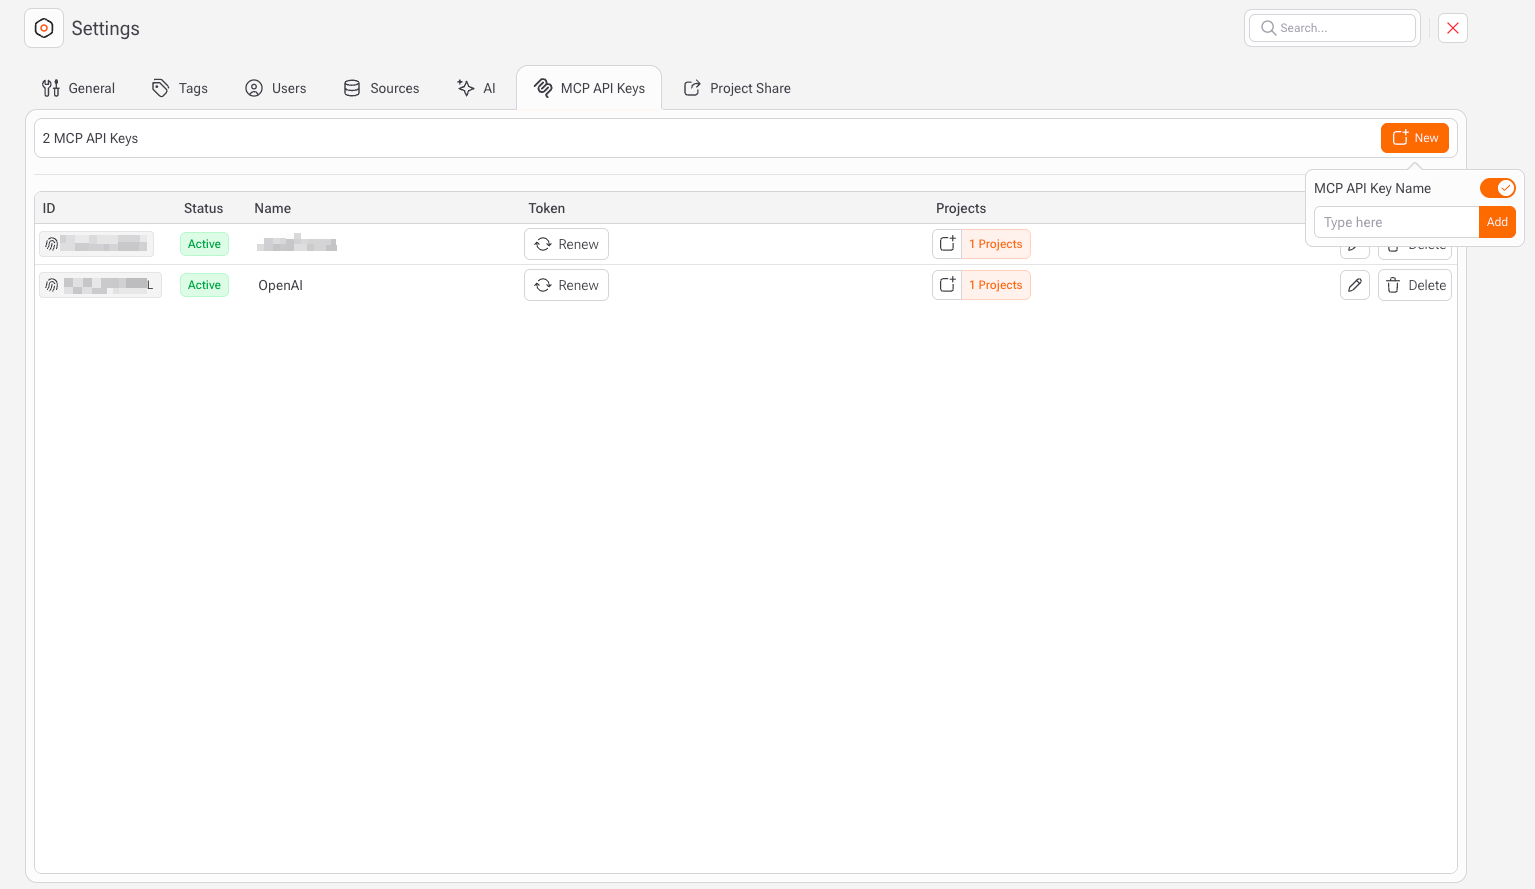
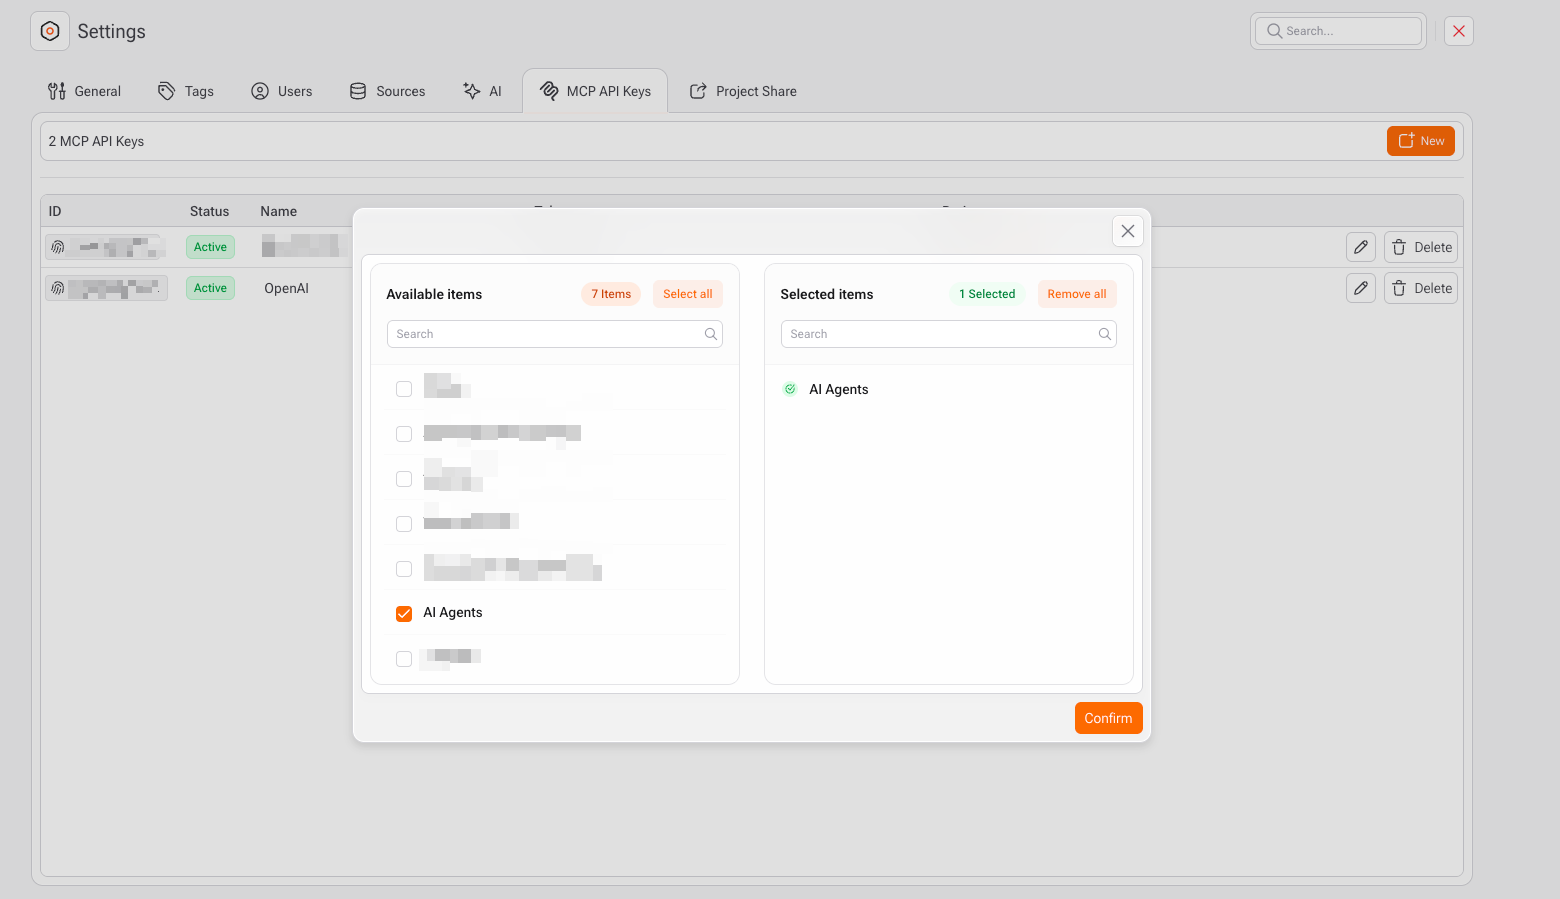
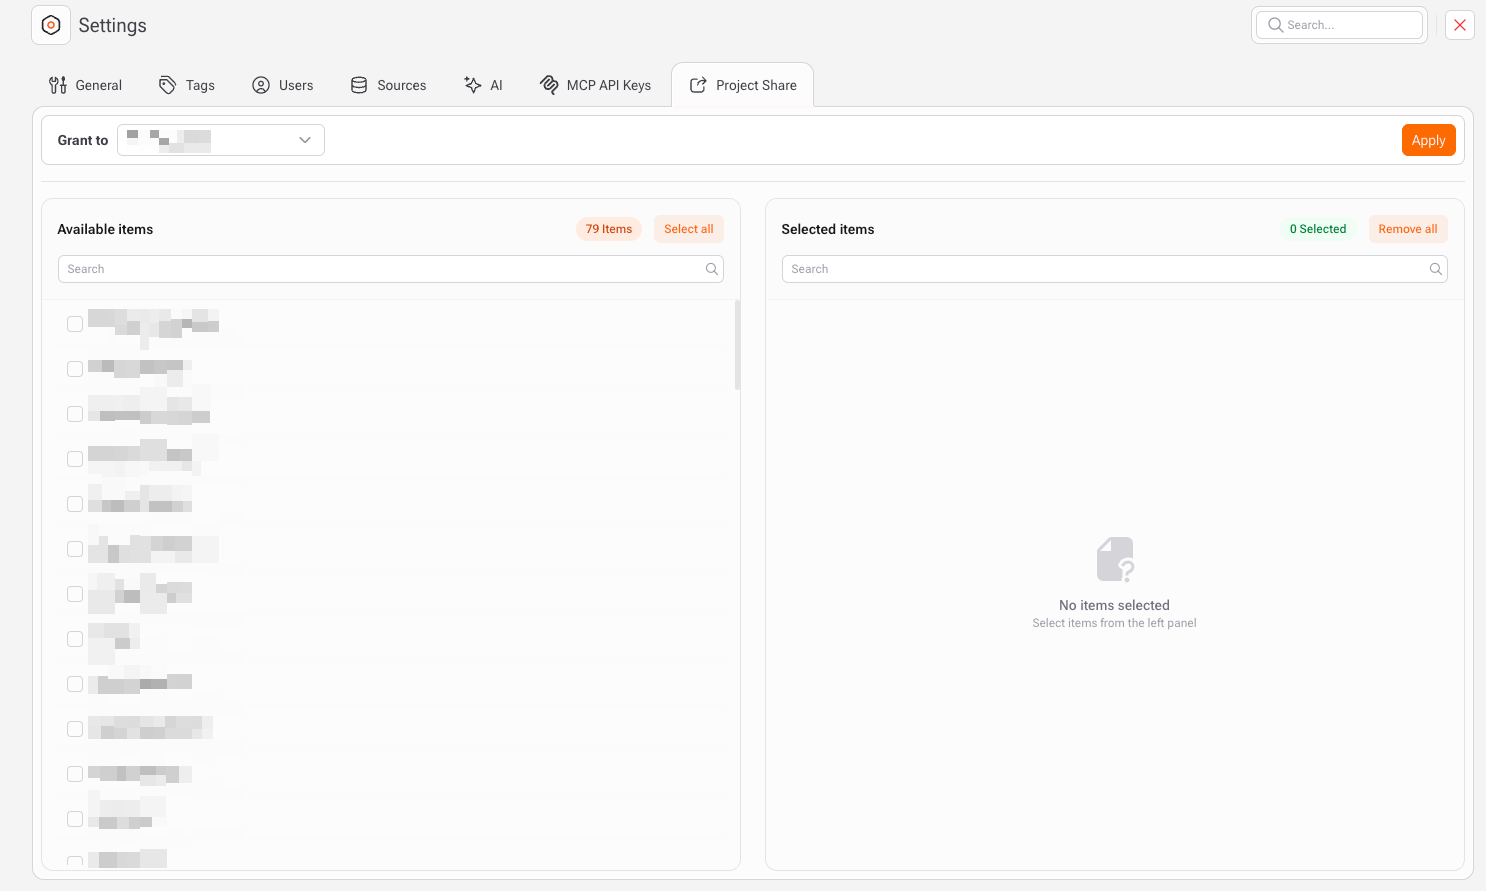
In addition to the default bucket, it is possible to **access buckets from other projects**—provided they are shared with the current project. This sharing is managed exclusively by administrators through:

* **Settings > Project Share**\
  → Admins can select the target project and grant access to specific buckets.

Once shared, these external buckets will appear under the *Sources* panel, grouped by the originating project name.

***

### &#x20;3. Registering and Authorizing External Databases

<figure><img src="/files/7s6klYmYuHXYxX4nkJnL" alt=""><figcaption></figcaption></figure>

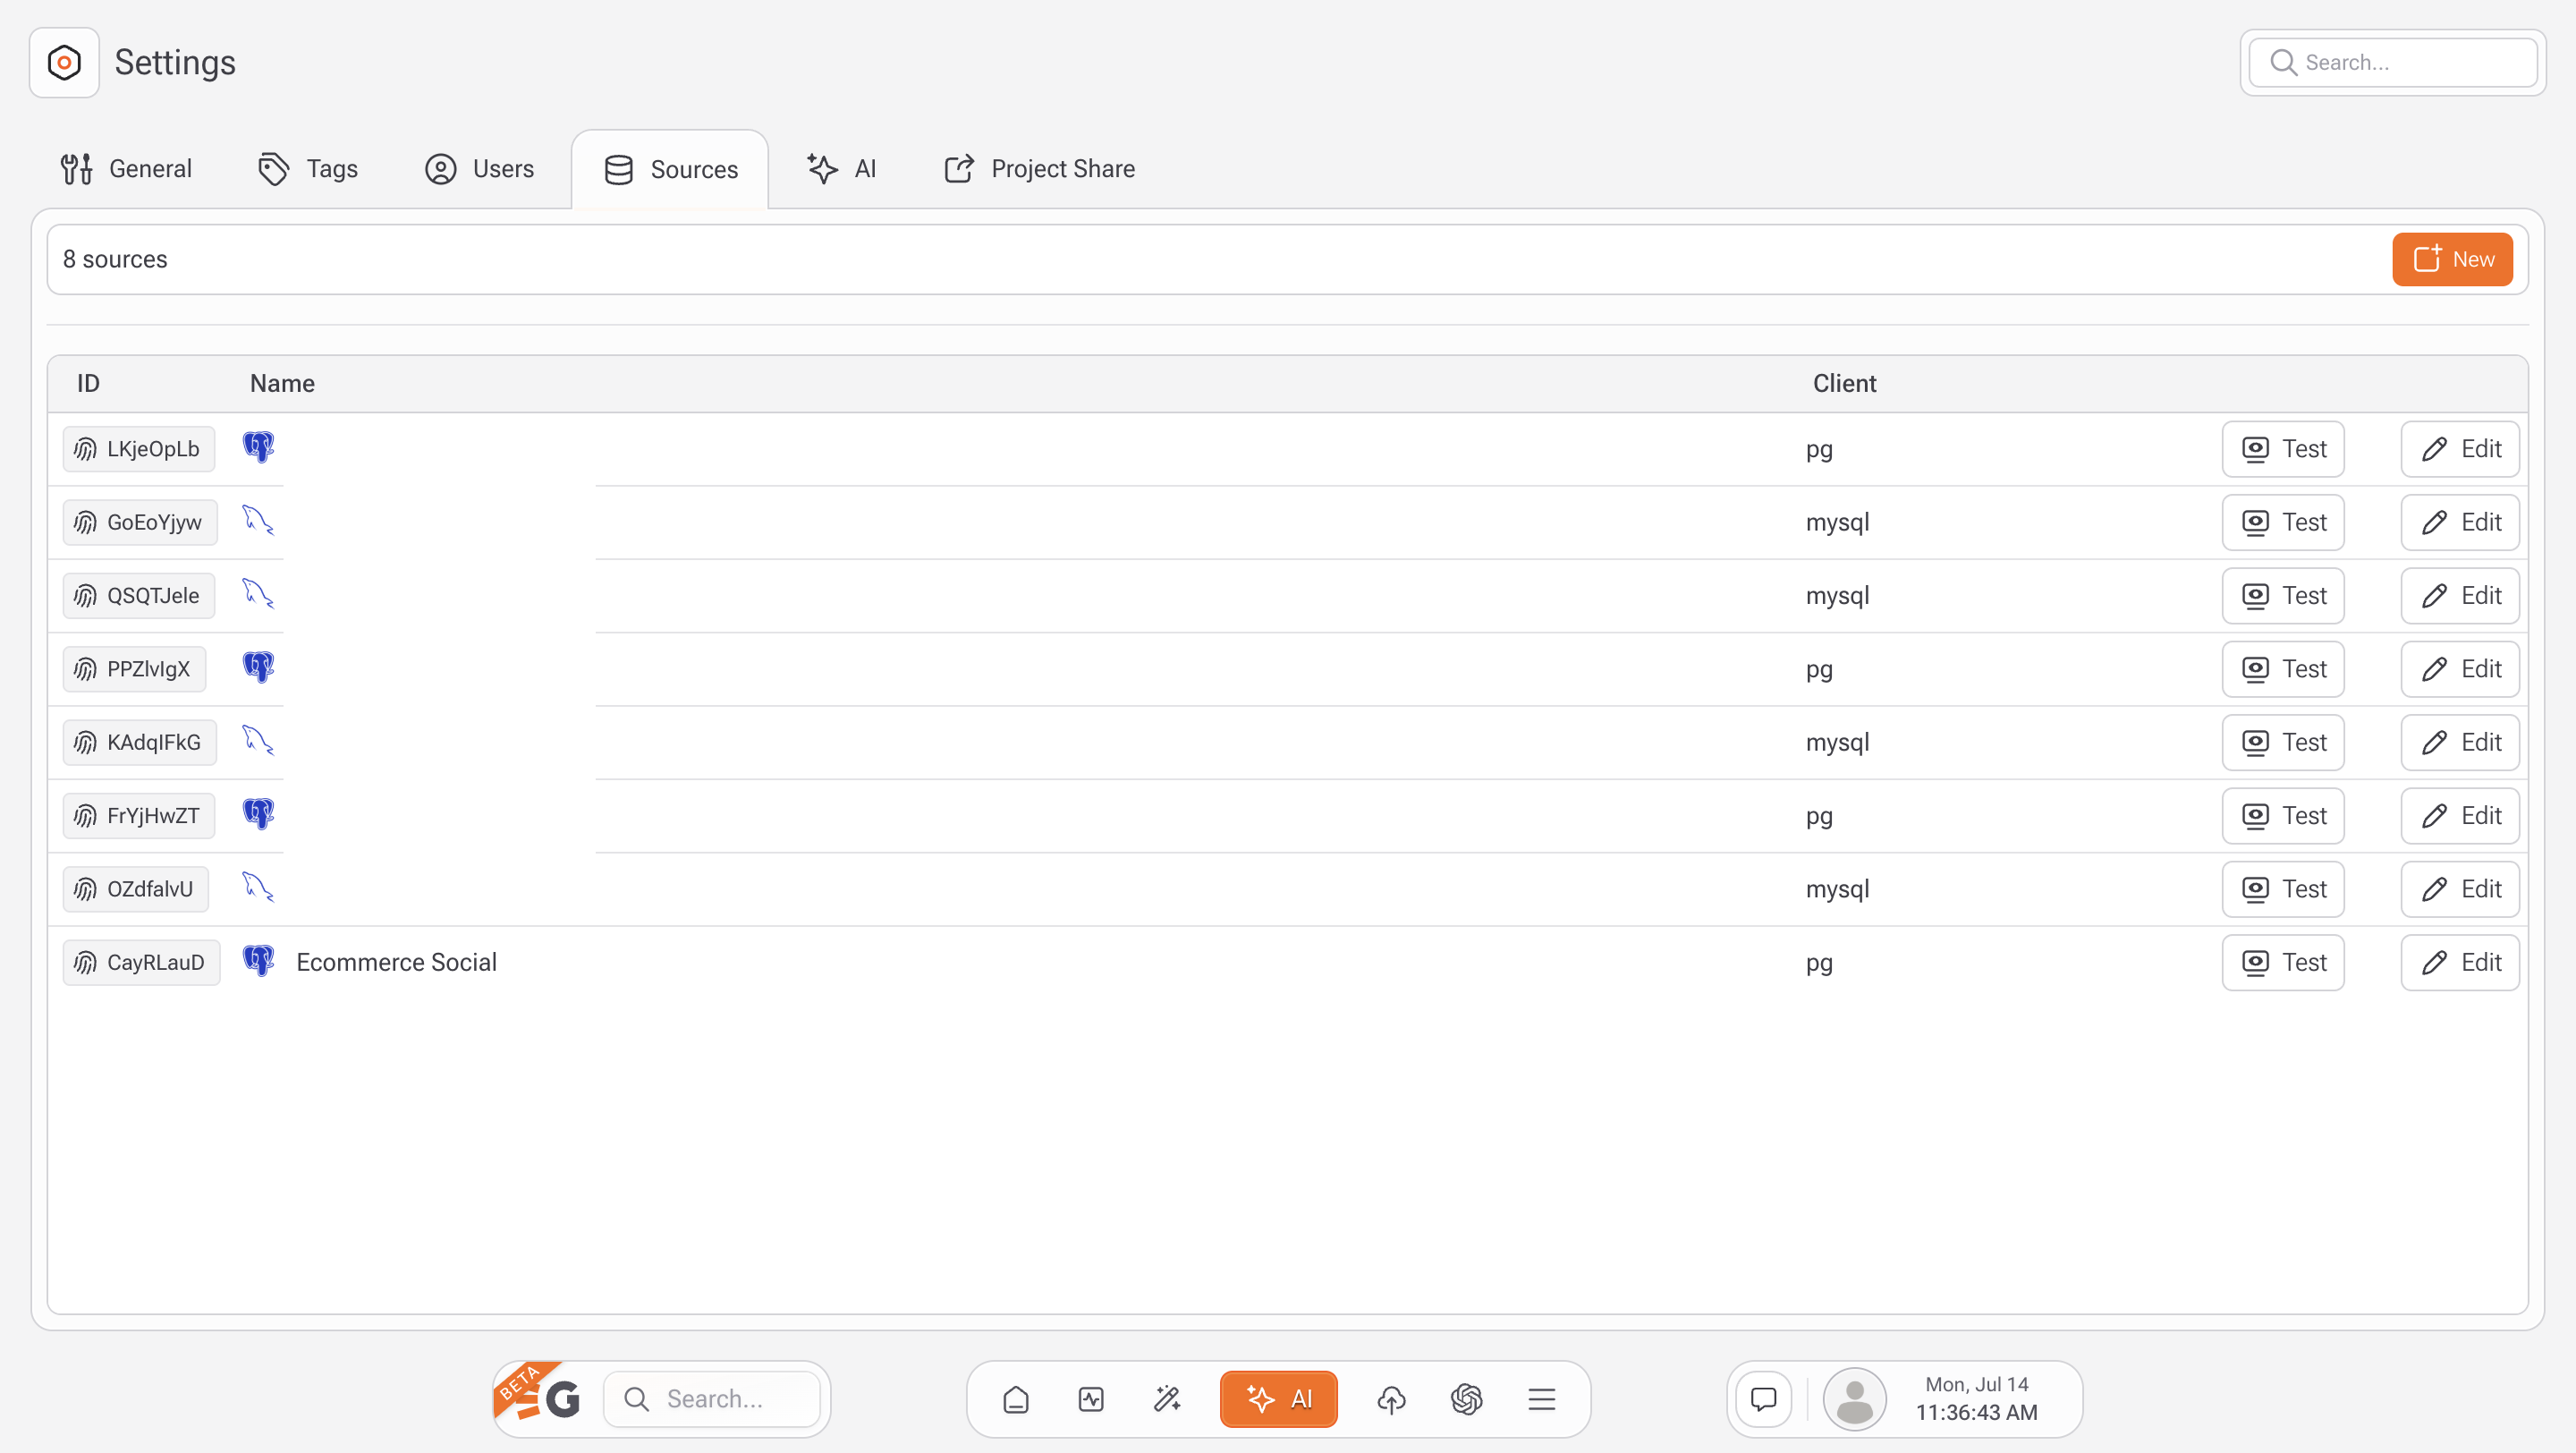
Gaio allows administrators to configure **connections to external databases**, such as:

* PostgreSQL
* MySQL
* SQL Server
* And more

This setup is done via:

* **Settings > Sources (Admin only)**\
  → Each source can be tested and edited to ensure secure and functional access.

{% hint style="warning" %}
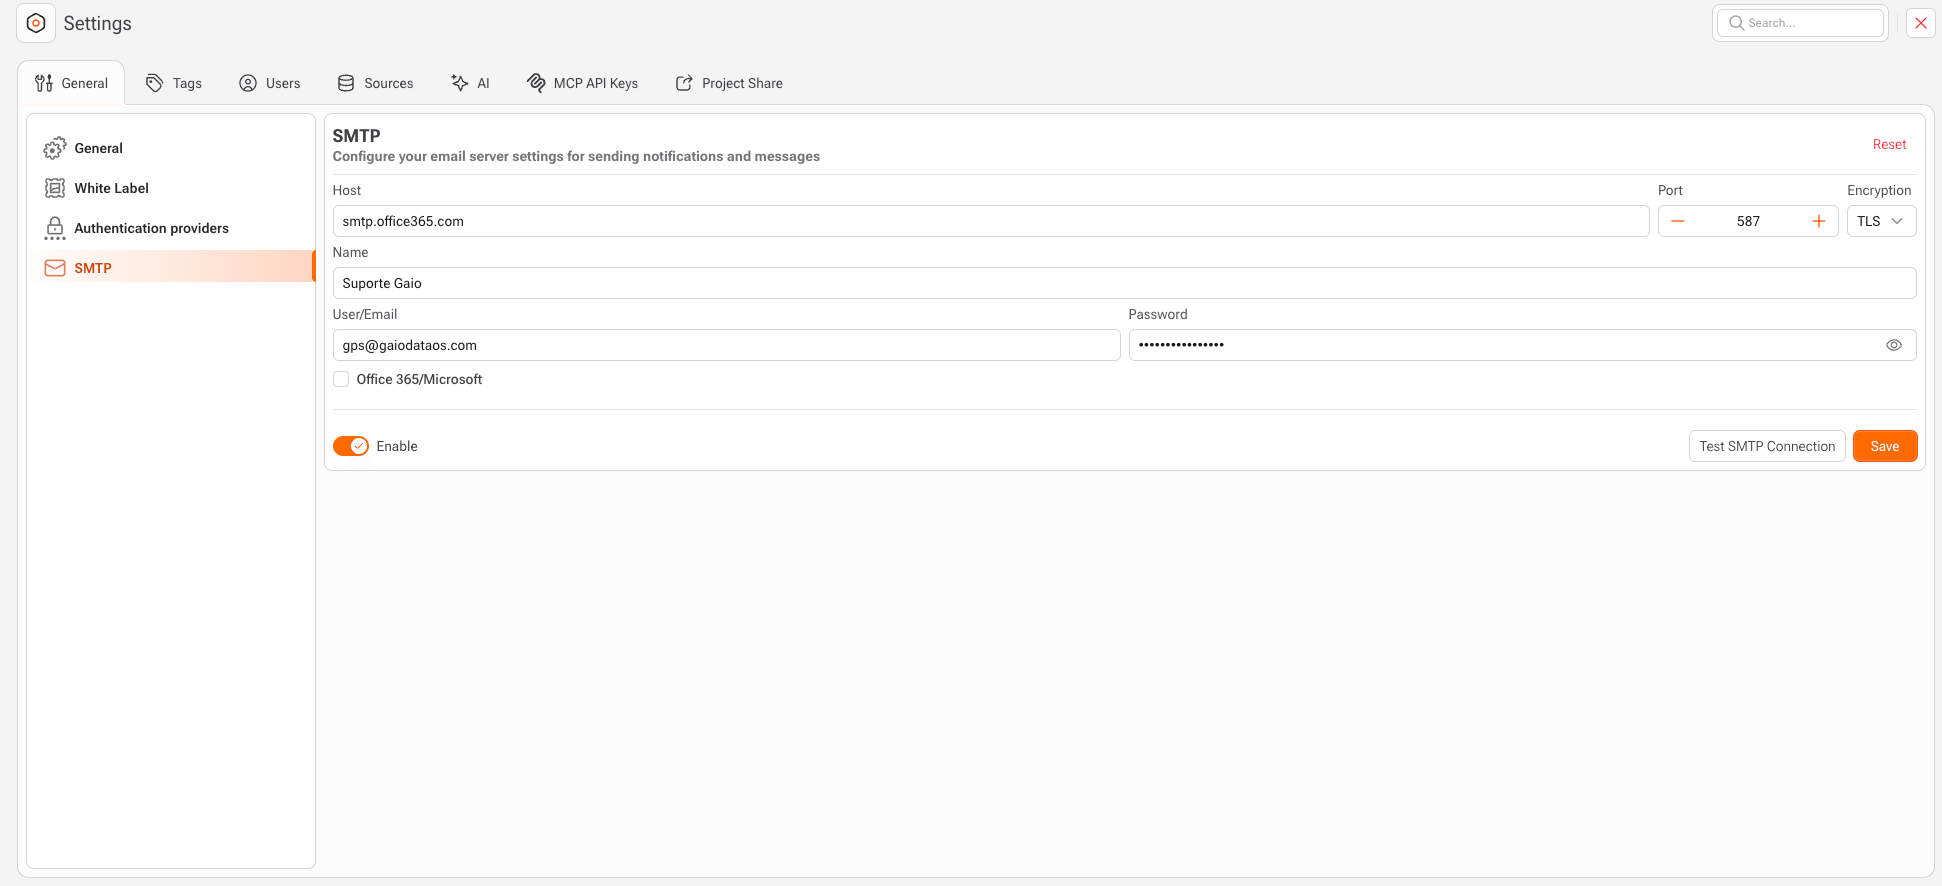
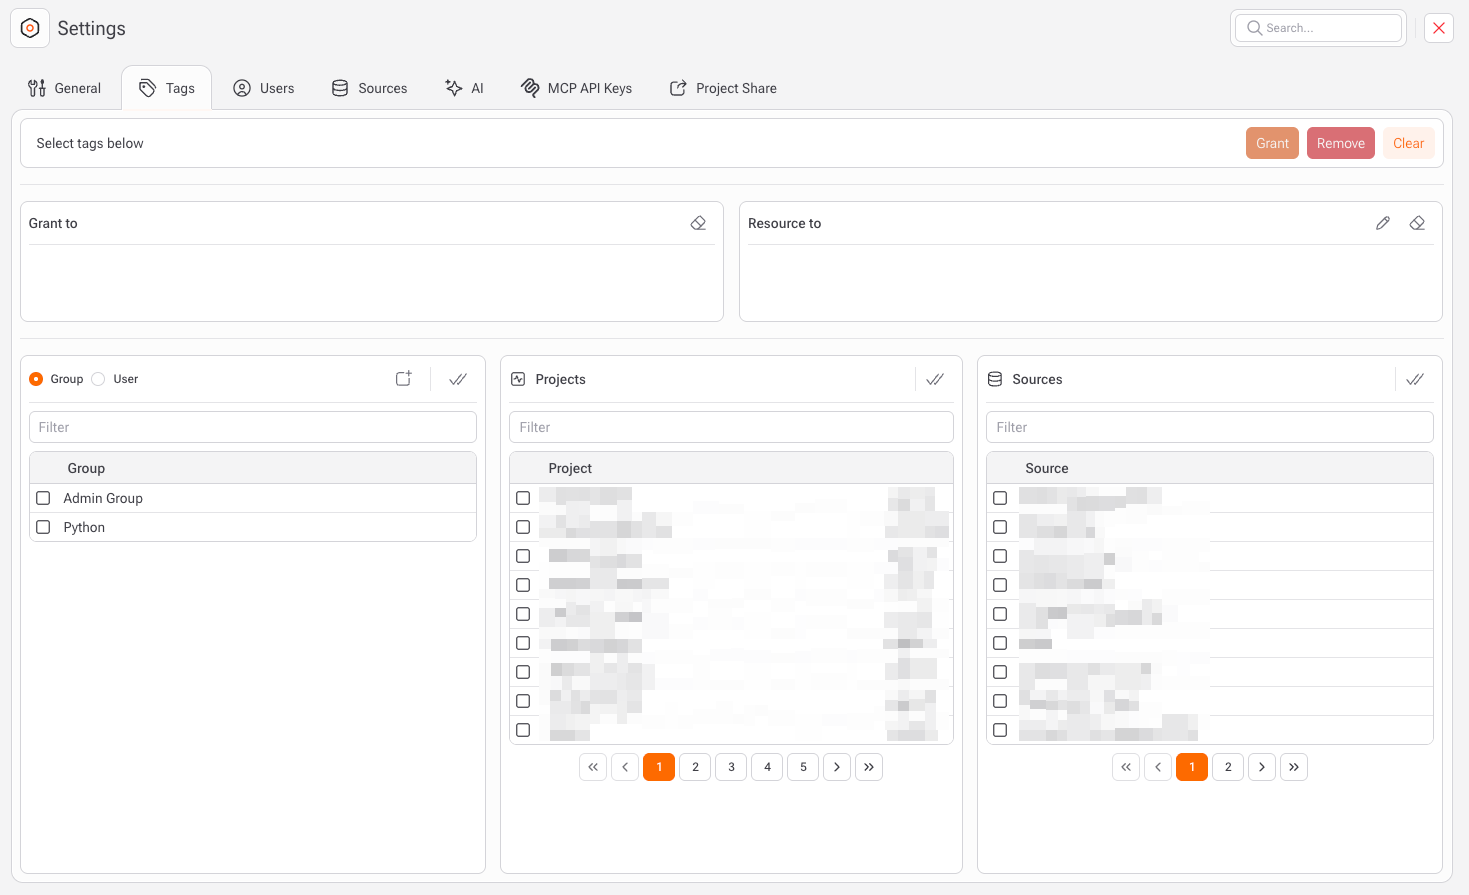
**Important**: After a database is registered, **access must be granted per user** through the **Tags** tab, where admins assign permissions to specific users for each data source.
{% endhint %}

***

### &#x20;4. Using Sources in Flows

Once permissions are set:

* All available sources will be visible in the *Sources* panel inside the studio.
* Users can **drag and drop tables** into the flow.
* These tables can then be connected to Builders, transformed, and stored in new tables within the project’s bucket.

***

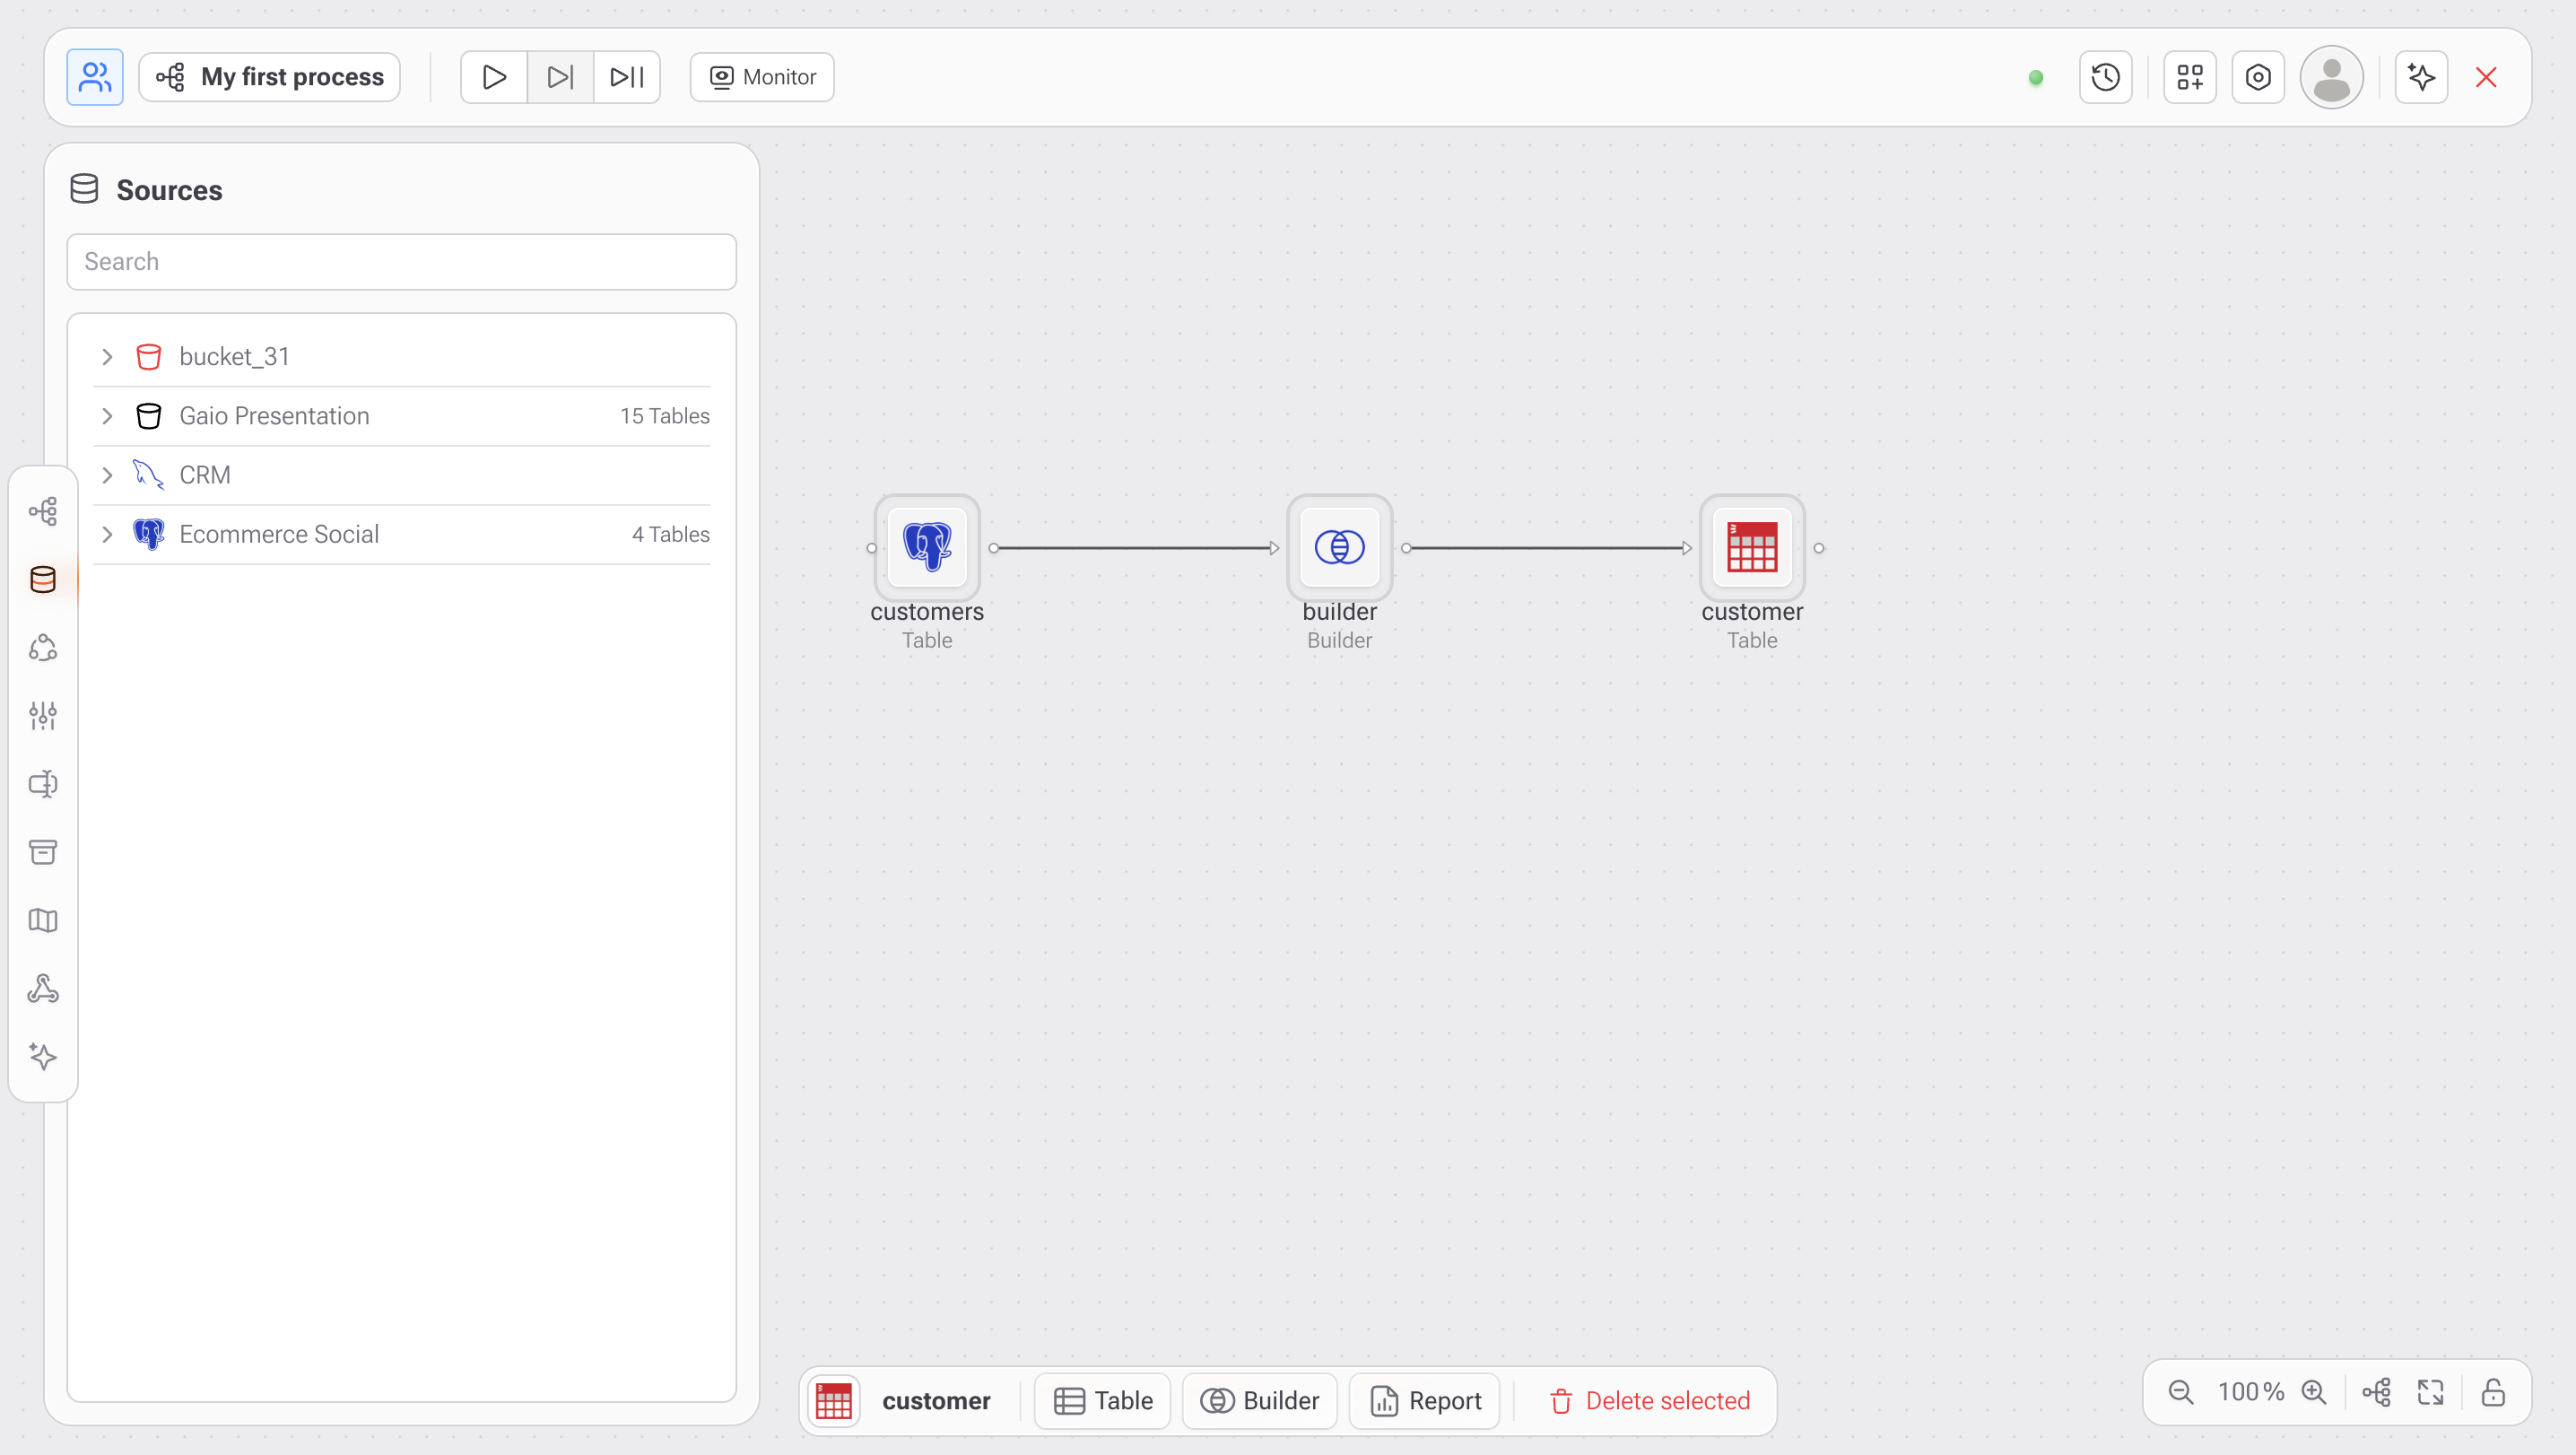
#### &#x20;Full Example

1. The project "Proj: Gaio Doc - Bucket 31" has its own bucket with tables like sales, `products`, and `customers`.
2. The admin shares the "Gaio Presentation" application’s bucket with "Proj: Gaio Doc - Bucket 31" via **Project Share**.
3. The admin registers a MySQL and PostgreSQL database in **Settings > Sources** and grants access to the user via **Tags**.
4. The developer working on "Proj: Gaio Doc - Bucket 31" now sees:
   * Their default project bucket.
   * The Gaio Presentation bucket with shared tables.
   * The Ecommerce Social and CRM databases as an accessible source.
5. They drag `customers` into the flow, use a Builder block, and generate a new table `customer`.


# Diagram (Schema)

<figure><img src="/files/OegushrixeiXAYTqXM3U" alt=""><figcaption></figcaption></figure>

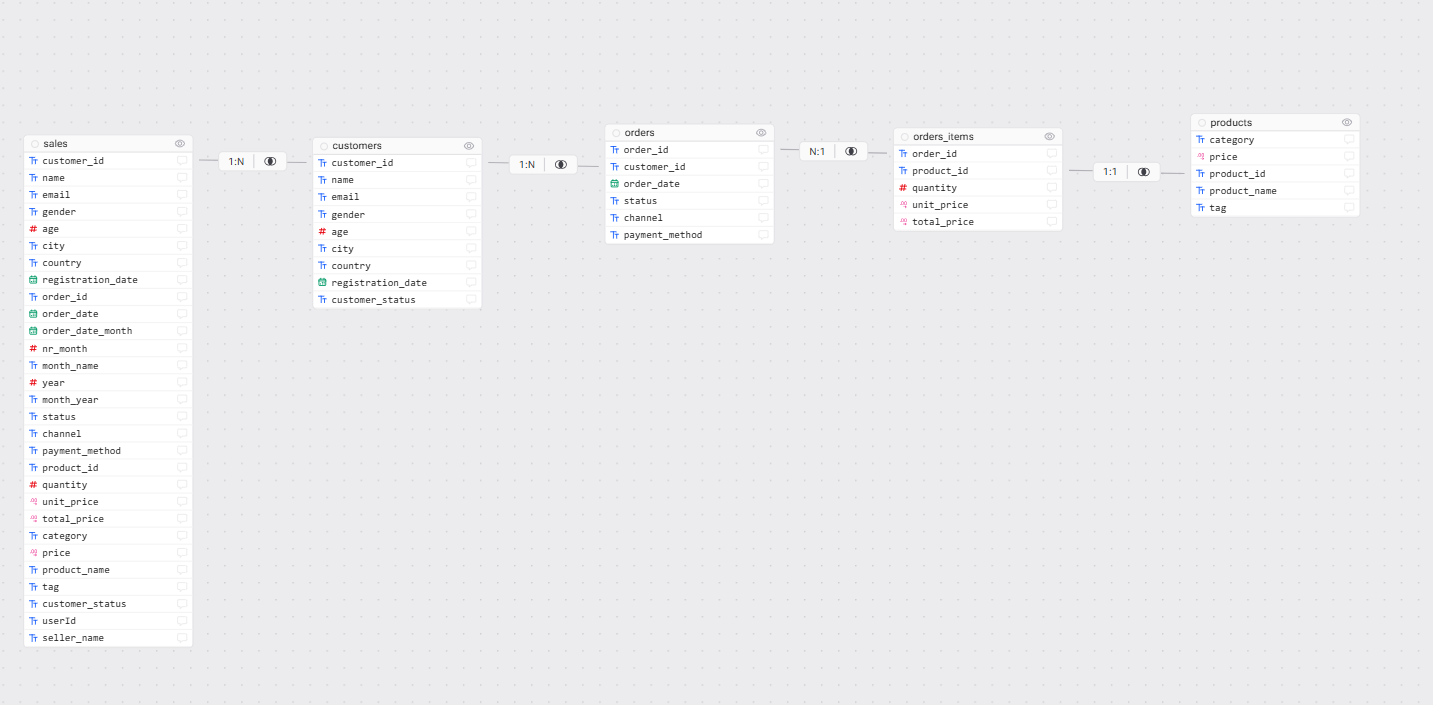
The **Diagram (Schema)** tool provides a **visual representation of data models and table relationships**. It helps developers and AI agents understand **how datasets are structured and connected**, making data exploration, analysis, and reasoning more accurate. This tool can also be **enabled for**[ **AI agents**](https://docs.gaiodataos.com/~/revisions/rkfXkYnUYKcE9UobTIFI/tools/agents), allowing them to interpret relationships between tables when answering questions or generating insights.

The Diagram tool is designed to:

* Visualize relationships between tables
* Clarify one-to-one, one-to-many, and many-to-many relations
* Serve as a reference for data modeling and analytics
* Provide structural context to AI agents

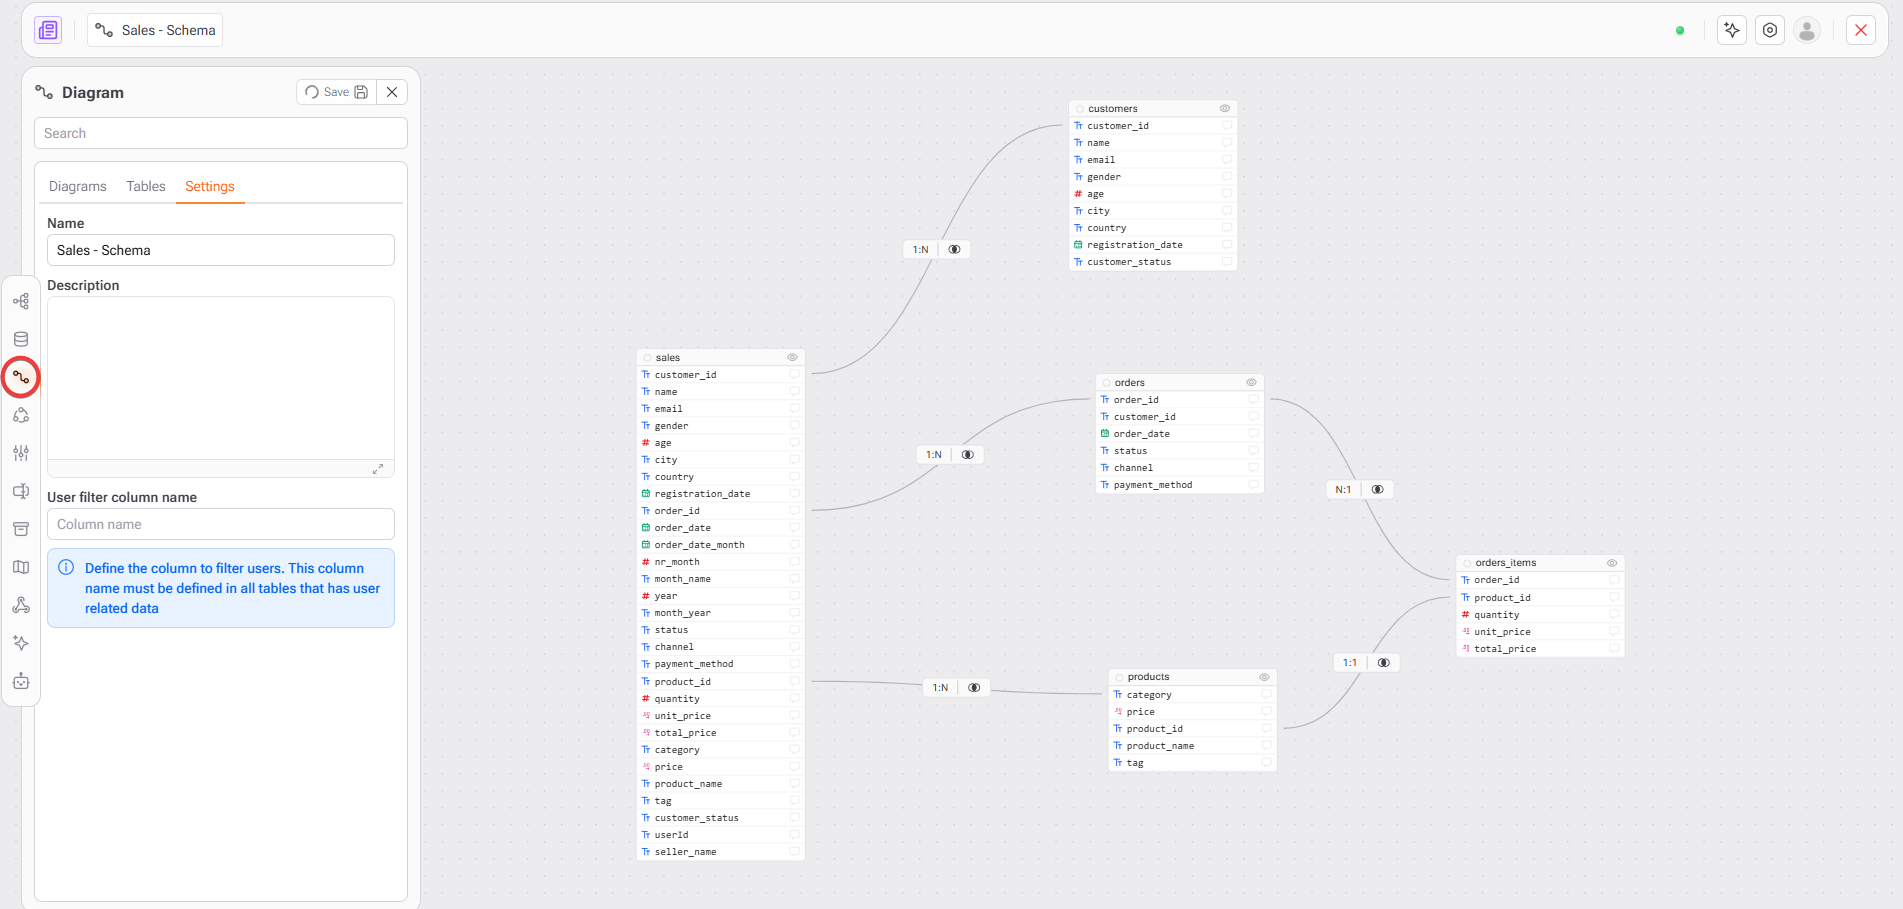
## How to configure diagrams&#x20;

<figure><img src="/files/WLNOwsj6EhbhyGYYpdOa" alt=""><figcaption></figcaption></figure>

1. Access the diagram via the icon in the side menu
2. Inside Settings, it is possible to define a clear name for the schema or diagram.
3. Describe the purpose and scope of this schema.
4. Define the column used to filter user-related data.
5. In the tables tab, users can select and filter the tables they want to drag onto the canvas.
6. After dragging the desired tables, the user can create relationships between the databases using the keys for each table.
7. After relating the tables, it is possible to define the relationship cardinality.
8. Click the **Save** button to persist the schema configuration.
9. Access the diagram configured in the Diagrams tab at the panel.

These relationships help both users and agents understand:

* How data flows
* Which tables should be joined
* Where aggregations make sense

## Metadata Viewer

<figure><img src="/files/LgUoI1yqdo5UzPdjVaQ3" alt=""><figcaption></figcaption></figure>

Click **“View metadata”** to access the generated schema metadata.

This metadata is represented as a **JSON structure** and includes:

* Tables
* Columns
* Data types
* Nullability
* Database and schema references

***

### Metadata Structure Explained

#### Tables Section

```json
{
  "tables": [
    {
      "tableName": "sales",
      "databaseName": "bucket_78",
      "fields": [...]
    }
  ]
}
```

| Attribute      | Description                        |
| -------------- | ---------------------------------- |
| `tableName`    | Table where the column belongs     |
| `columnName`   | Column name                        |
| `columnLength` | Column size (if applicable)        |
| `dataType`     | Physical data type and nullability |

#### Why Metadata Matters

The metadata generated here is used by:

* **AI features** (contextual understanding of data)
* **Query builders**
* **Data discovery**
* **Governance and lineage**
* **Automated documentation**

It ensures that:

* Column semantics are consistent
* AI responses are accurate
* Downstream tools understand the schema correctly

## How AI Agents Use the Diagram

When enabled for an AI agent, the Diagram allows the agent to:

* Understand table relationships before querying
* Choose correct join paths
* Avoid incorrect assumptions about data structure
* Explain results with structural context

## Best pratices

* Keep schemas focused and domain-specific
* Use clear and consistent naming
* Define user filter columns when applicable
* Avoid overly complex diagrams in a single schema
* Enable diagrams only for agents that need structural understanding

{% hint style="success" %}
A clean schema improves both human and AI comprehension.
{% endhint %}


# Tasks


# ETL


# Builder antiga

The Query task is the most important task in Gaio. All data manipulation is carried out through it. When using it, Gaio is building an SQL command to send to the database and return a new table. If the table already exists, Gaio deletes and recreates it. However, there is the possibility of not deleting, but accumulating data in the table, by activating the **Insert Mode button** (19), which will use the SQL INSERT feature instead of deleting and creating a table.

{% hint style="info" %}
When a Query task is run without Insert Mode (17) enabled, the following sequence of actions is performed:

1. If there is, deletion of the result table (DROP TABLE);
2. Execution of the SQL query generated by it;
3. Creates the table 'result table' (CREATE TABLE);
4. Insertion of data into the generated table (INSERT INTO).
   {% endhint %}

![](/files/NIObIAJHCPQPGe9so2PX)

1. Query name
2. Table name
3. Save button
4. Save and Run button
5. Preview button
6. SQL Button
7. Source table columns
8. Calculated Field
9. Aggregated Fields
10. New table columns
11. Filter: Columns that will be filtered
12. Grouping: Columns to be grouped
13. Sorting: Columns that will be sorted
14. Rows: Limit number of rows for the new table (LIMIT)
15. Limit by: Column that will be used as criteria for categorization when there is a limit on rows
16. Page (offset): Pagination
17. Relationship between tables (JOIN)
18. Column Properties
19. Insert Mode (INSERT)
20. close button

## 1. Query Name

By default the name will be query, but you can define a name that helps identify what was done in the query. This name cannot start with a number or be less than 3 characters long.

## 2. Table Name

Set a name that cannot start with a number or be less than 3 characters long. If the table name starts with tmp\_ , it will be a [temporary table and therefore it is easily deleted ](file:////o/0AwHT1YPyV5KV6qHeJNz/s/-MPpFa6rq60XeC7QMDh7/documentacao-1/gestao/repositorios/gestao-de-dados)along with the other temporary tables. It is good practice to use temporary tables so as not to consume excess disk space.

## 3. Save Button

This button saves the query, but does not execute it and therefore the table generated by it will not be recreated. It is useful when the task takes a longer time to execute, and you do not want to run it at the moment.

## 4. Save and Run Button

By clicking on this button, Gaio will save the query and execute it, regenerating the query's target table.

## 5. Preview button

With this button, you can preview what the result of the query will be like before you even run it. Gaio sends the SQL to the database bringing only 10 rows. It is possible after the preview is displayed, to change the number of lines to be displayed.

![](/files/g8xvflDy9vw8Foz1lKyY)

{% hint style="info" %}
In some situations, the result of the preview may differ from the final table. This is because the preview does not fetch the data from the source, sends a file with the result and imports the data into an internal Gaio table, as the execution of the query does. In the preview, you just run the query and the result is shown.
{% endhint %}

## 6. SQL Button

Gaio displays the SQL code that will be executed, however it cannot be edited. To build SQL manually, use the [SQL task ](file:////o/0AwHT1YPyV5KV6qHeJNz/s/-MPpFa6rq60XeC7QMDh7/documentacao-1/studio/tarefas/etl/sql)to query tables that are already in Gaio or the [External SQL task ](file:////o/0AwHT1YPyV5KV6qHeJNz/s/-MPpFa6rq60XeC7QMDh7/documentacao-1/studio/tarefas/etl/sql-externo)to perform direct manual queries on the source databases (SQL Server, Oracle, PostGreSQL, MySQL, MariaDB and MemSQL).

## 7. Source table columns

The tables being used in this query are displayed here. Within them (when clicked), their respective columns are displayed and can be moved to the center of the window for various purposes such as filters and ordering.

## 8. Calculated field

Using this button, it is possible to create a new column using SQL functions. Such functions can range from simply extracting the year from a date to executing complex SQL queries to generate the column.

ANSI SQL can be used in the construction and functions from the database (DBMS) that is currently being consulted can also be used. When querying tables that are already in Gaio, functions from the [ClickHouse DBMS must be used ](https://clickhouse.tech/docs/en/sql-reference/functions/).

Pay attention to the type of column that this calculation will generate. If it is a text column, you will not be able to do calculations with it later. It can also take types such as date, numeric and others.

### **Examples**

Convert date/time in text format to date format. In this case, there will be an automatic effort to identify the format of your text.

```
parseDateTimeBestEffort('12/12/2020 12:12:57')
```

## 9. Aggregate Fields

This item lists the columns that were aggregated with some function (sum, average, min, max, count, etc.). They are available there to be dragged to the options in the center of the screen.

## 10. New table columns

Here the columns that will be in the table that will be generated from this query are defined. They can be columns that are exactly the same as the source tables, they can be calculated from the Calculated Field and they can also be aggregations (average, minimum, maximum, etc.). All items that are in that location will be in the generated table.

## 11. Filter: columns that will be filtered

In this item, filters are applied to the data, for example, viewing takes data from only one state to the table. Here you can only use columns that will filter data in the source tables and/or in calculated fields that are not aggregating data.

### Filter on aggregated fields

When aggregating a column using, for example, average, sum, minimum, maximum and others, the **Filter item appears in aggregated fields** on the screen. This is where you can filter aggregated columns. This happens because this filter is applied after the data is generated, after the aggregation is consolidated and not before as in the previous filter option.

![](/files/oRR5iV8b6Ekrh3mGZAE1)

## 12. Grouping: Columns to be grouped

If a column was aggregated with, for example, a sum, in general some column will be used for the sums to be presented by it, such as the sum of sales by State. In this case, the State is a column to be grouped, as it is desired to see the sums of sales for it. In SQL practice, the columns that are not being aggregated (sum, min, max, etc.) must be in **Grouping** .

## 13. Sorting: Columns that will be sorted

Keeping in mind the columns that will be in the output table, several columns can be inserted in this item, which can be sorted ascending or descending. Gaio will respect the sequential order in which the columns were inserted in this field for sorting.

## 14. Rows: Limit number of rows for the new table (LIMIT)

This feature is very useful in two situations:

1. The query will return a lot of data and if you want to see a good set of data before the final execution, for example limit 1000 rows.
2. In conjunction with sorting, it is possible to create a TOP 20 sellers, limiting the query to 20 lines, for example.

## 15. Limit by: Column that will be used as criteria for categorization when there is a limit on rows

## 16. Page (offset): Pagination

Thinking about the previous item (13. Limit), it may be desired to return 100 lines, but starting from line 1,000. This item will allow such a data set to be made available in the generated table.

## 17. Relationship between tables (JOIN)

For SQL users, this is just an interface to build relationships between tables that will have their columns available to be used in formulas and be available in the table to be generated.

![](/files/PeXhGMKAdAosVvRnrKd0)

This button will open the window below that will allow you to join different tables, including those from different applications (as long as it is shared with the application in use).

At this point, it is necessary to inform the columns through which the two tables are related. If the relationship between the two tables is based on more than one column, it will be necessary to click the Join button on the previous screen more than once.

As many tables as necessary can be related by repeating this procedure.

The result of the relationship between the two tables can be in 4 ways.

![](/files/hCeIvsPwU3pYVHRET0jO)

* **Inner join** : only the lines that match in the two tables will be brought.
* **Full join** : all rows from both tables will be brought (it usually brings duplicates and should only be used when the user is fully aware of what will be returned, as it can lead to errors in data analysis.
* **Left join** : all rows from the left table and the data it finds in the right table will be brought based on the columns that join them.
* **Right join** : all rows from the right table and the data found in the left table will be brought.

## 18. Column Properties

Here it is possible to change the name that the column will have in the generated table, aggregate, change the column formatting, not its type. To change the type of a column it is necessary to use functions in the Calculated Field.

## 19. Insert Mode (INSERT)

The standard procedure when completing activities in this Query task will be to execute. At this point, if the table already existed, it will be deleted and created again. However, if this option is checked (Insert Mode), Gaio will not delete the table, but will place the new data at the end of the table that already existed.

## 20. Close button

Name of the process that is creating the query: This location only displays the name of the process where this query is being created or edited.


# REST antiga

<figure><img src="/files/dWDv1k6UvbPyBbqRGc3r" alt=""><figcaption></figcaption></figure>

Unlike the API task, this task instead of providing an Endpoint for other systems to use Gaio, it allows Gaio to connect to external APIs.

To use it, the analyst must know how to use the API to which Gaio will connect. Systems that provide connection via API have the standard of providing documentation.

A table is required to use the **Rest** task. It will provide, for example, the CPF column that will allow you to return data from an external system of those CPFs present in the source table. If no data is required to be sent to the API, it is still necessary to have a reference table, which may not provide data. However, it is important that for each row of the table, Gaio will make a call to the provided endpoint.

Gaio only interprets JSON when returning from the API.

The first step is to click on the table, go to the Tasks menu and click on **Rest**.

![](/files/DtyOS8BFnNHPqXSlV33z)

![](/files/f1HjvThDMHs70mN3xRJE)

1. **Type of request** : Gaio allows connections to endpoints using GET or POST.
2. **Endpoint** : Enter the target API endpoint. At this address it is possible to pass columns from the source table, such as <https://www.receitaws.com.br/v1/cnpj/> **{{cnpj}}** . In this case, **cnpj** is a column from the source table. Their values will be passed to the queried API and the return will be written to a Gaio table.
3. **Maximum request time** : if 0 is entered, Gaio will wait for the API to return for an unlimited time. At this point the time is recorded in milliseconds (1000 = 1 second).
4. **Properties and Values** : Define the headers sent during the API request. Ex: Bearer, Authorization, Accept among others.

### **5. Return**

Various settings can be adjusted to work with the API data return.

* Define the name of the table that will store the return.
* Choose between identifying return columns automatically or manually.
  * **Automatic** : The task will identify the name, quantity and type (data type) of the columns within the list or the API return object. If desired, inform Gaio of the property/endpoint where the name/data types are located. If the response is a JSON OBJECT, one line will be inserted into this table, but if the response is a LIST/ARRAY in JSON, one line will be inserted per item in this list.
  * **Manual** : It is necessary to define the fields that will be captured from the API response. If the response is a JSON OBJECT, one line will be inserted into this table but if the response is a LIST/ARRAY in JSON, one line will be inserted per item in this list.
* **Source table data** : it may be desired to take some fields from the source table to the destination table, such as a queried customer code.
* **Delete table before inserting data** : it is possible to accumulate the returned data in the destination table or delete it whenever the process is executed. Two fields will be added to the created table: gaio\_id which refers to a unique numeric value and gaio\_created\_at which refers to the date-time of insertion of the row into the table
* Property of the object where the results are located: if the returned **JSON** has an object with a hierarchy within it, it is possible to return this hierarchy and build a new table, using this option. The way to call is for example **result.data** .

### **6. Error log**

Define the name of the log table, which will always start with **log\_** and from this point on can be customized by the analyst.


# Builder

<figure><img src="/files/tlFODQQW4hZTjEHlwCAQ" alt=""><figcaption></figcaption></figure>

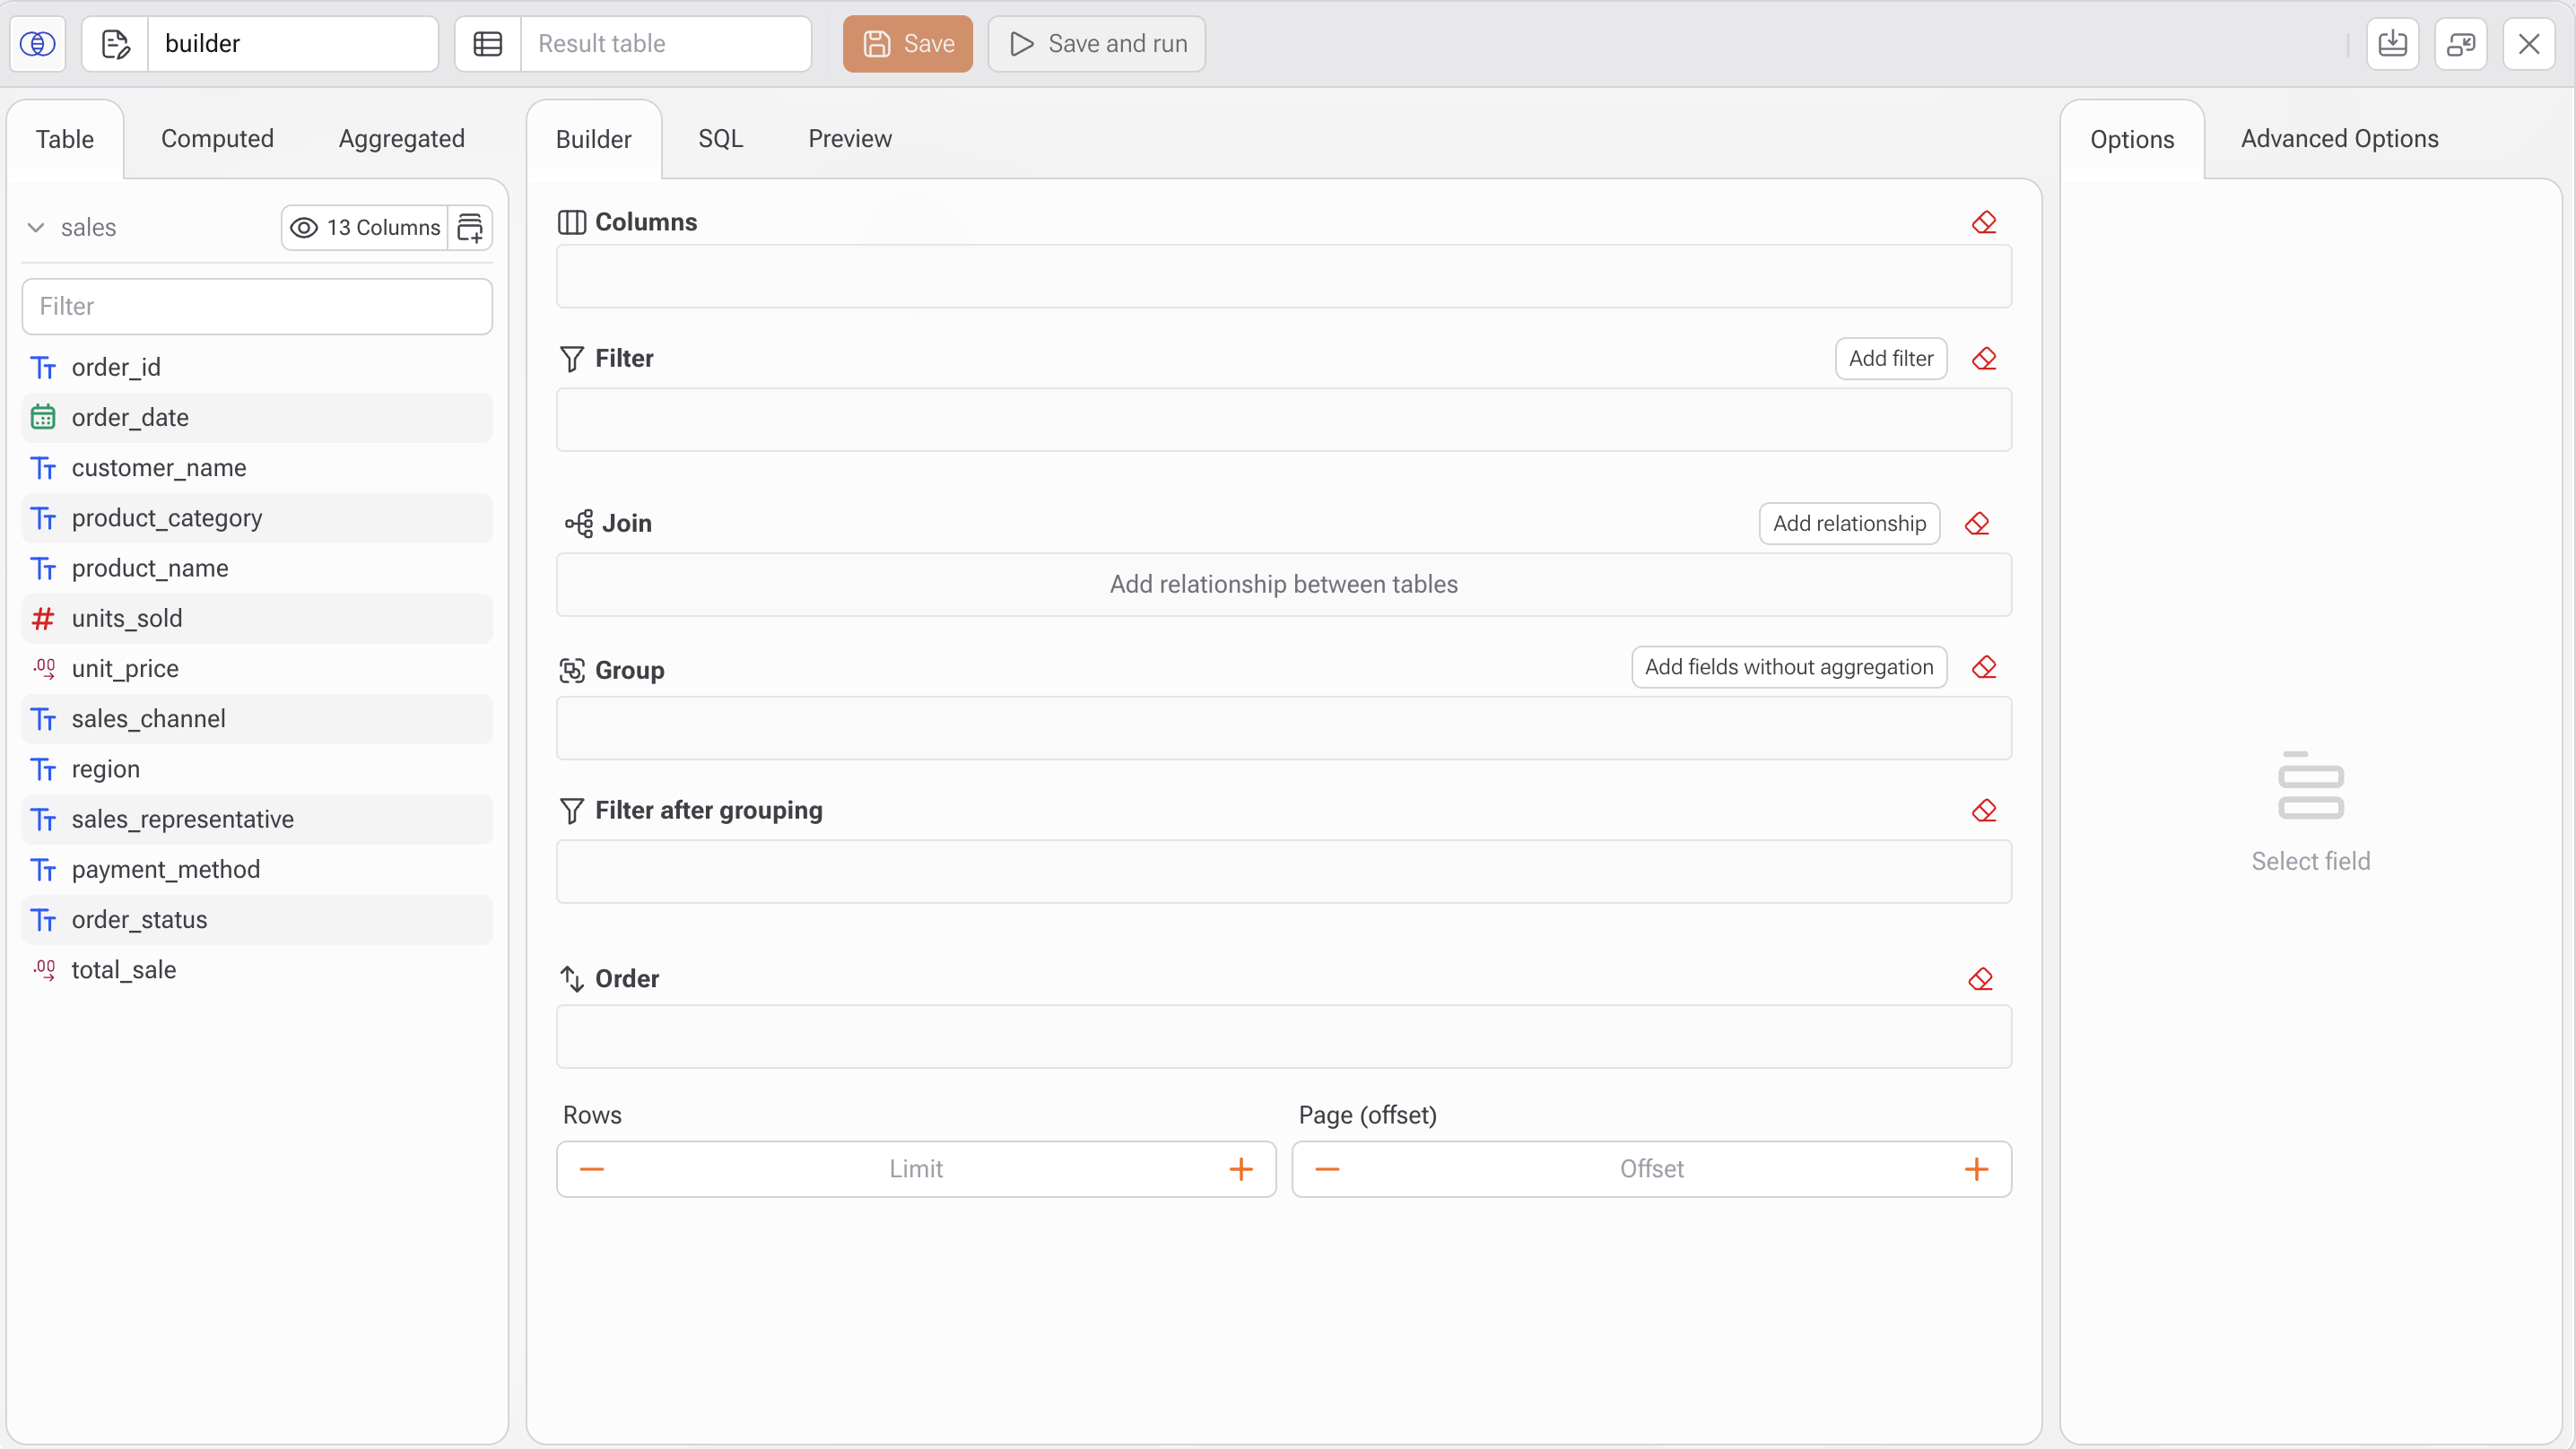
The **Builder** is Gaio DataOS’s visual query builder.\
It allows both technical and non-technical users to construct structured queries in a simple and intuitive way — without writing SQL code (though the generated SQL can be viewed and edited at any time).

***

## &#x20;How to Use the Builder

***

### **1. Insert and Select a Table Block**

* Add a **Table** to your flow and choose the dataset you want to work with.
* The Builder task will only become available once a table is selected.

### **2. Open the Builder Task**

* In the left-hand menu, go to: **Tasks > ETL > Builder**
* On the left panel, all available fields will be listed below, with icons indicating data types (text, number, date, etc.).

### **3. Configure Basic Info**

* **Task label**: (optional) Add a name for the task to identify it in your flow.
* **Table**: The table should be automatically linked from your selected block (e.g., `new_sales`).

***

### 4. **Build Your Query Visually**

Inside the **Builder** tab, you can construct your query using the following blocks:

**Columns:** Choose the fields you want to display in the results and apply aggregate functions like `SUM`, `COUNT`, `AVG`, etc.

**Filter:** Apply conditions to narrow down the dataset (e.g., `region = 'South'`, `units_sold > 5`).

**Join:** Link other tables using relationships (JOINs).

**Group:** Group the data by one or more columns.

**Filter After Grouping:** Filter the grouped results (e.g., show only products with total sales above 100 units).

**Order:** Sort the result set based on selected fields.

**Rows & Page (Offset):**&#x20;

* **Limit**: Max number of rows to return.
* **Offset**: Number of rows to skip (useful for pagination).

***

### 5. **Use Query Features**

In addition to the **Table** tab, you’ll find two options at the top left:

**Computed:** Create **calculated fields** using custom expressions.\
Example: `units_sold * unit_price` to generate a total sales field.

{% hint style="warning" %}
To use parameters in calculated fields, the user must enter **‘{{parameter\_name}}’** in their function or as a value.
{% endhint %}

**Aggregated:** Manage and view all **aggregated fields.**

***

### 6. **View the Output and Logic**

At the top of the screen, you’ll find two useful tabs:

**SQL:** Displays the **SQL code automatically generated** based on your configuration. You can review, copy, or even edit it as needed.

**Preview:** Shows a **real-time preview of the query results**, helping you validate the logic before saving.

***

### 7. **Run or Save the Query**

* Click **Save** to store your query configuration.
* Click **Save and run** to immediately execute the query and preview the results.

***

#### Best Practices

* Use **Computed** fields to create metrics directly in your query.
* Always review the **SQL** tab to understand what’s being executed.
* Use **Preview** to validate the output before saving or publishing.
* Name your queries clearly to keep your project organized.


# SQL

<figure><img src="/files/y0vcWzOQ9K9JImS3eReQ" alt=""><figcaption></figcaption></figure>

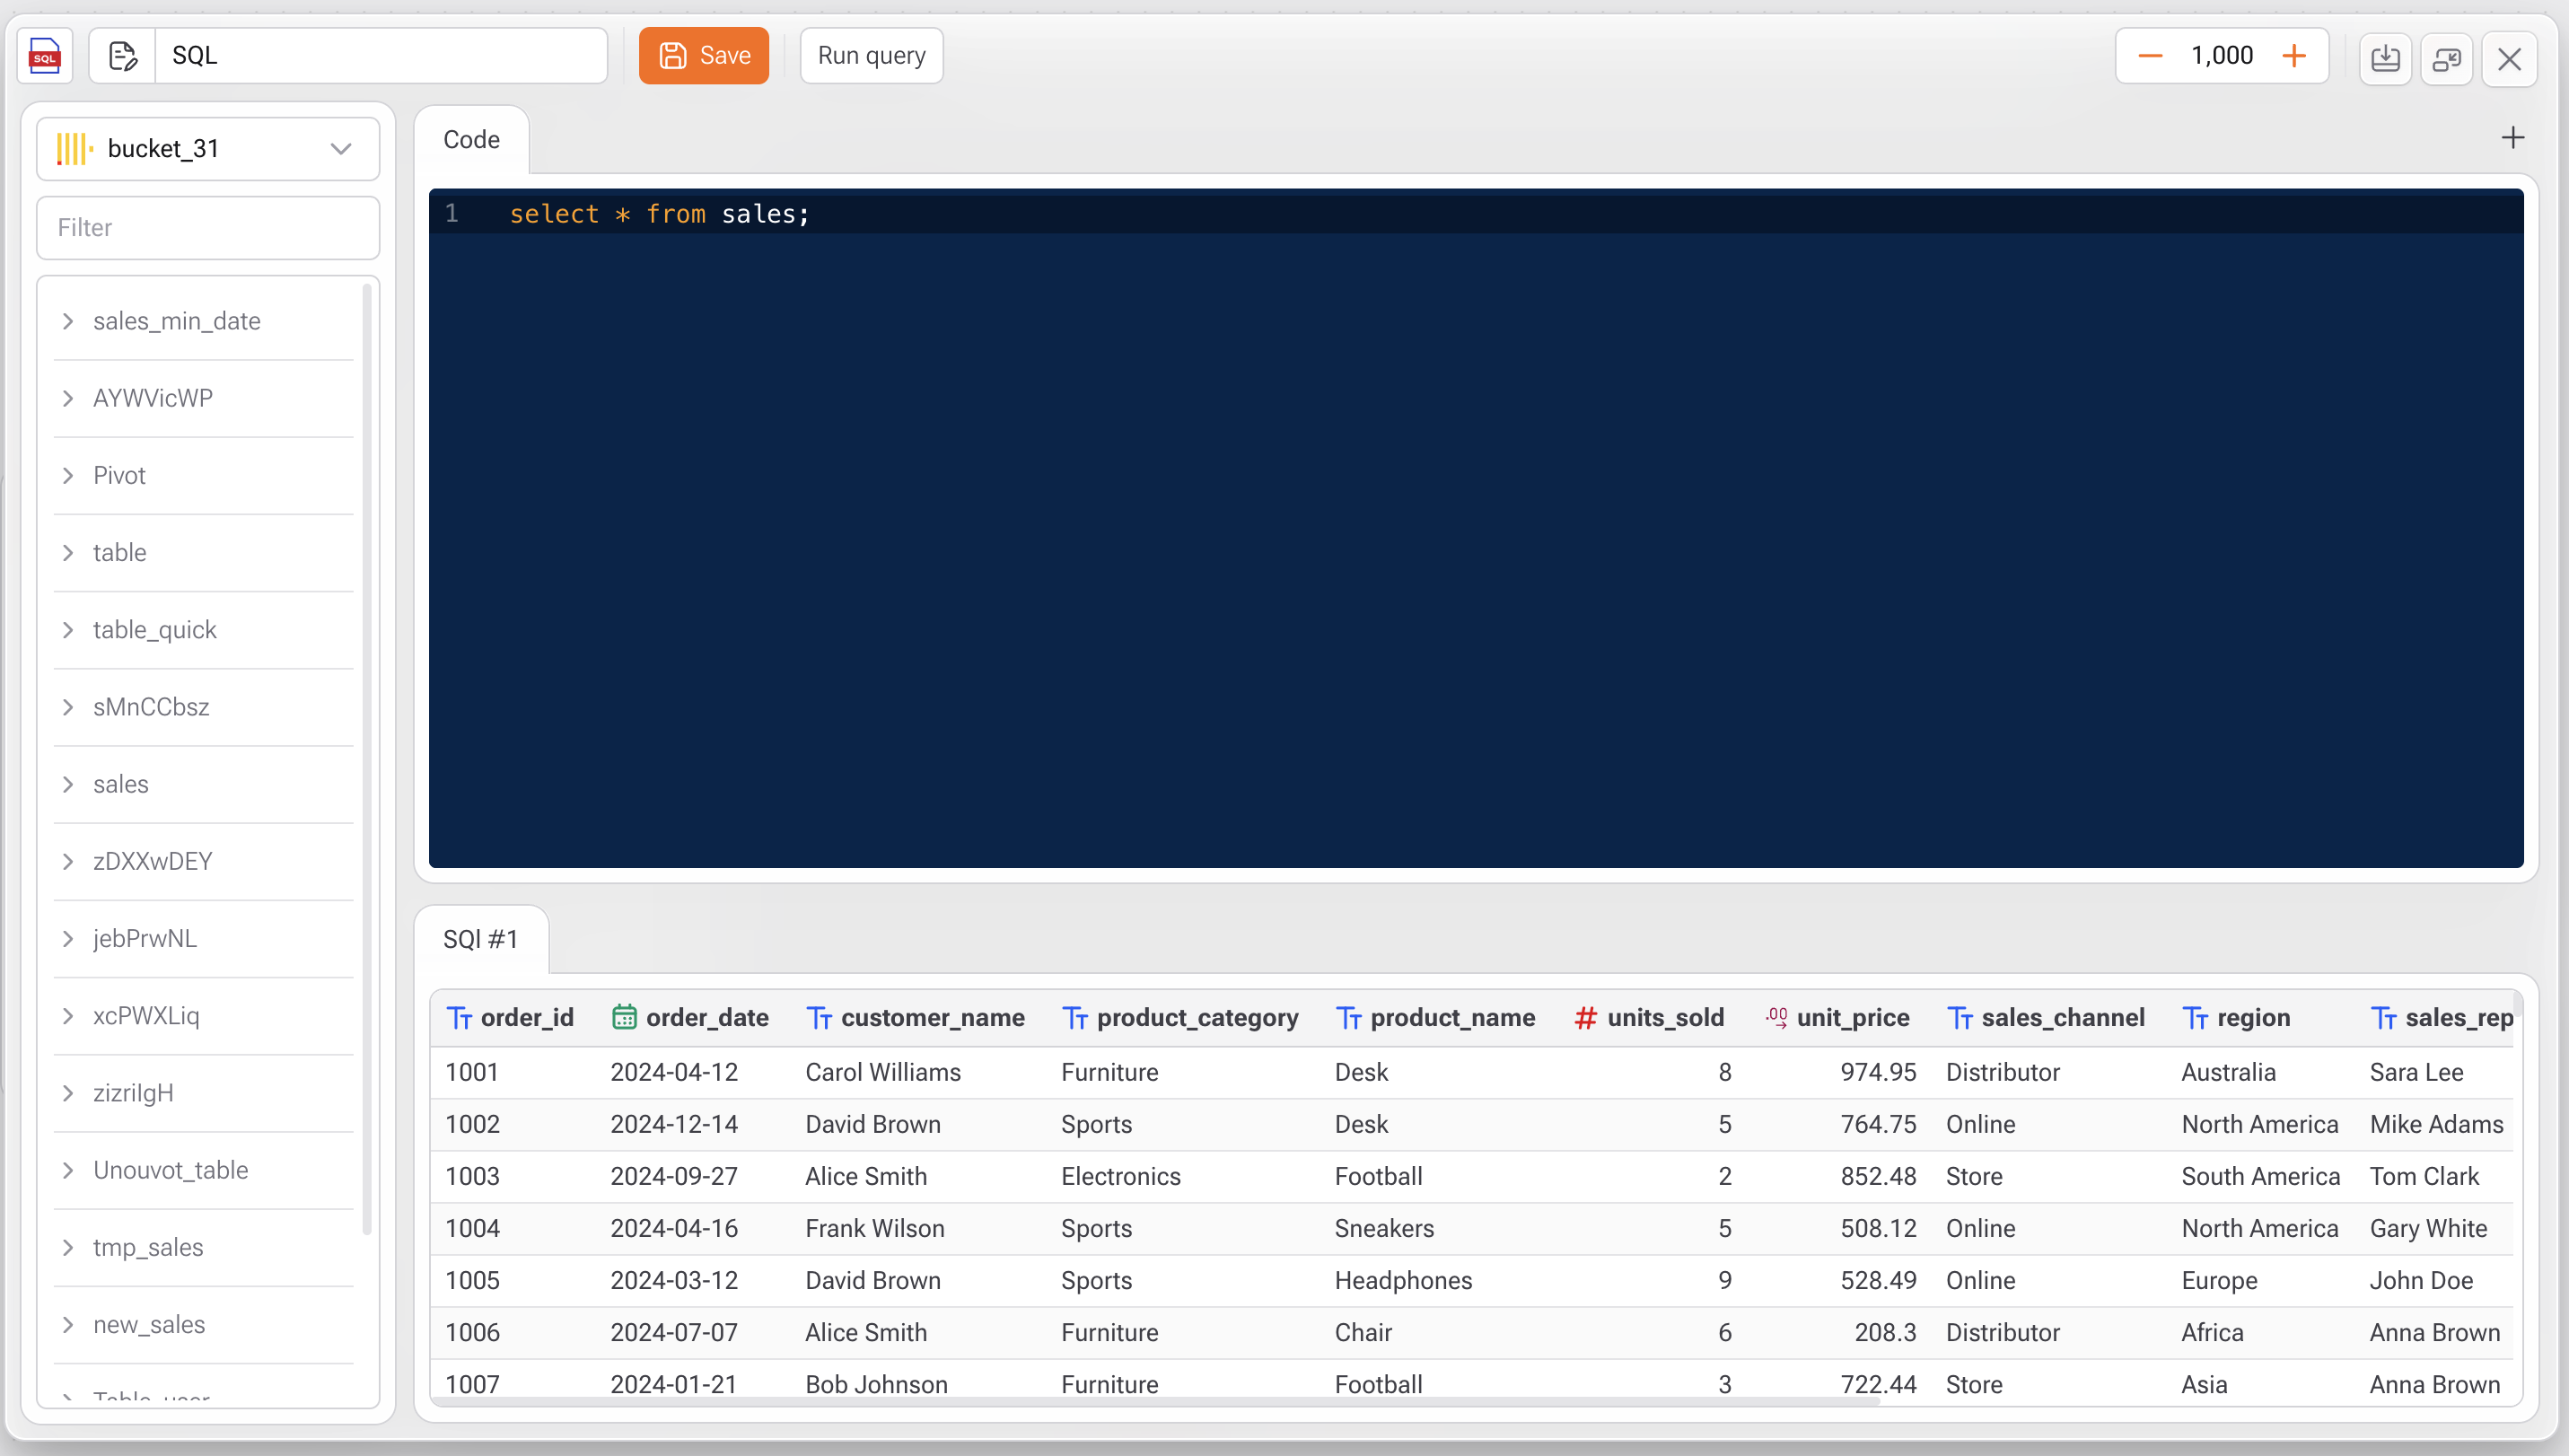
The **SQL Editor** in Gaio DataOS allows users to write, run, and test custom SQL queries directly on tables within the selected project bucket. It's a powerful tool for advanced users who prefer full control over data manipulation using SQL.

***

## &#x20;How to Use the SQL Editor

***

### 1. **Access the SQL Editor**

* In the **Studio**, open the left-side panel under **Tasks**.
* Select the **SQL** option to open the code editor.

***

### 2. **Select the Bucket**

* At the top left, select the **bucket** that contains the tables you want to query.
* All available tables in that bucket will be listed below for reference.

***

### 3. **Write Your SQL Query**

* In the central editor area, type your SQL query.\
  Example:

  ```sql
  SELECT * FROM sales;
  ```
* The editor supports syntax highlighting for better readability and clarity.

***

### 4. **Run the Query**

* Click **Run query** to execute your SQL.
* The result will appear in a preview panel below the code.

You can paginate the result using the row limit control on the top right (`1,000` by default).

***

### 5. **Save Your Query**

* Click **Save** to store the SQL block as a reusable task or part of a data flow.

***

#### Additional Features

| Feature                  | Description                                              |
| ------------------------ | -------------------------------------------------------- |
| **Syntax Highlighting**  | Enhanced readability with colored keywords.              |
| **Result Table Preview** | View output immediately after running your query.        |
| **Multiple SQL Blocks**  | Add more SQL blocks using the **+** button.              |
| **Run Flow Integration** | SQL blocks can be integrated into larger data processes. |

***

#### Best Practices

* Use aliases for column names when working with JOINs.
* Avoid `SELECT *` in production queries — explicitly define your columns.
* Test queries with limited row counts before running on full datasets.

<br>


# Files Ingest

<figure><img src="/files/esD2ZMCFY15CesZfYbpV" alt=""><figcaption></figcaption></figure>

The **File Ingest Task** allows you to ingest files from **remote storage systems** into Gaio DataOS.\
It is commonly used to automate data ingestion from external servers such as **SFTP or FTP**, enabling repeatable and reliable file-based pipelines. This task focuses on **connecting to a remote source**, **selecting files using flexible patterns**, and **storing them locally** for downstream processing.

The File Ingest Task is designed to:

* Connect to external file servers.
* Download one or multiple files.
* Support dynamic file selection patterns.
* Store files locally for further processing.
* Enable automated and scheduled ingestion workflows.

## How to configure Files Ingest

1. Provide a descriptive name for the task.
2. Select the protocol used to access the remote server.
3. Select the authentication method used to connect.
   1. Password-based authentication (SFTP and FTP).
   2. Key-based authentication (SFTP and FTP).
   3. Anonymous (without password).
4. Enter the hostname or IP address of the remote server.
5. Specify the port used by the selected protocol.
6. Enter the username used for authentication.
7. Imports a specific file, all files with the given extension or all files from the folder.

{% hint style="warning" %}
When importing more than one file, the remote folder path must end with /\*
{% endhint %}

8. Specify the path to the file or folder on the remote server.
9. Define where the files will be stored locally.
10. Save and execute.

### Best Practices (File Ingest)

* Use explicit filenames when possible
* Use wildcards only when needed
* Always validate remote paths
* Keep local paths organized by pipeline
* Parameterize filenames for dynamic ingestion
* Test connectivity before production use


# Source SQL

<figure><img src="/files/X4nK7zu3RQG7EyfCgFe0" alt=""><figcaption></figcaption></figure>

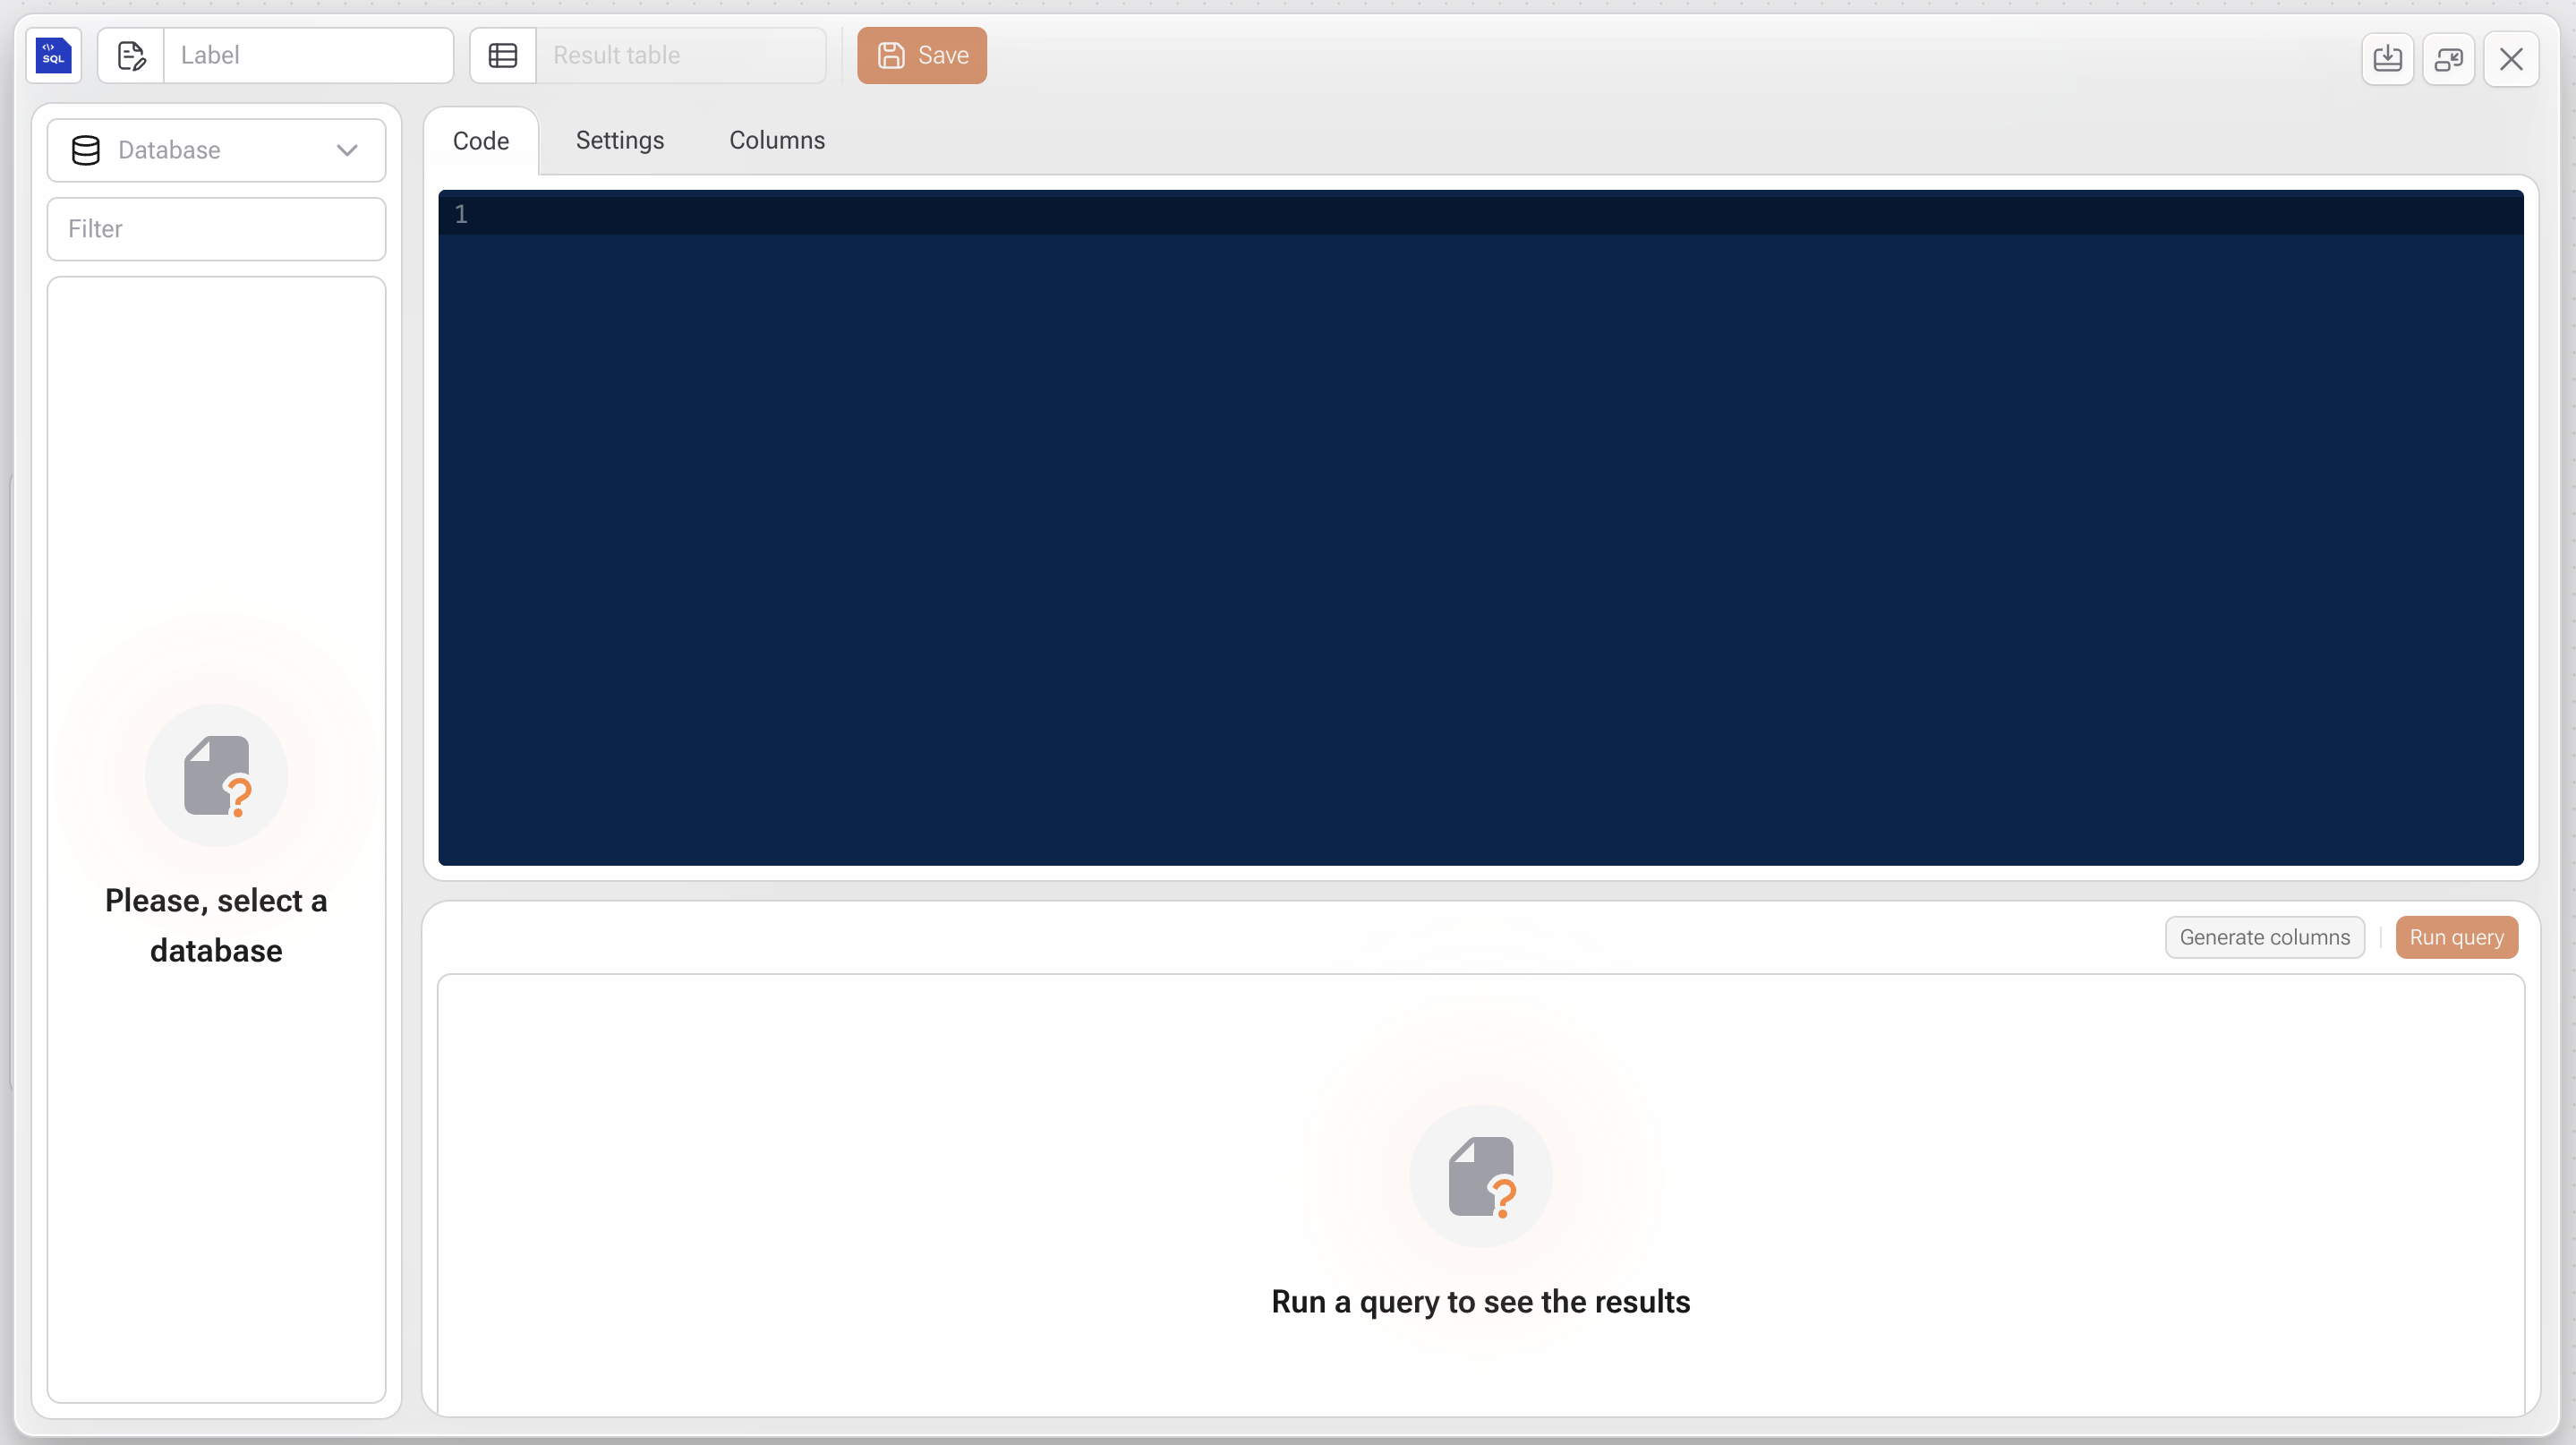
The **Source SQL** task allows you to run SQL queries directly on databases connected to Gaio DataOS.\
It is ideal for extracting, transforming, or importing data from external sources (such as relational databases) into your project for use in data flows, analysis, and dashboards.

***

## How to Use

### **1. Open the Task**

Navigate to: **Tasks > ETL > Source SQL**

***

### **2. Select a Database**

In the left-side panel:

* Select a database previously registered in the environment and released for your user ID.
* Once selected, all available tables from that source will be displayed.

***

### **3. Write the SQL Code**

In the **Code** tab:

* Type or paste your SQL query.
* You can use advanced SQL syntax, including `JOIN`, `WHERE`, `GROUP BY`, `CTEs`, and more.

{% hint style="info" %}
Use **Run query** to test the results before saving the task.
{% endhint %}

***

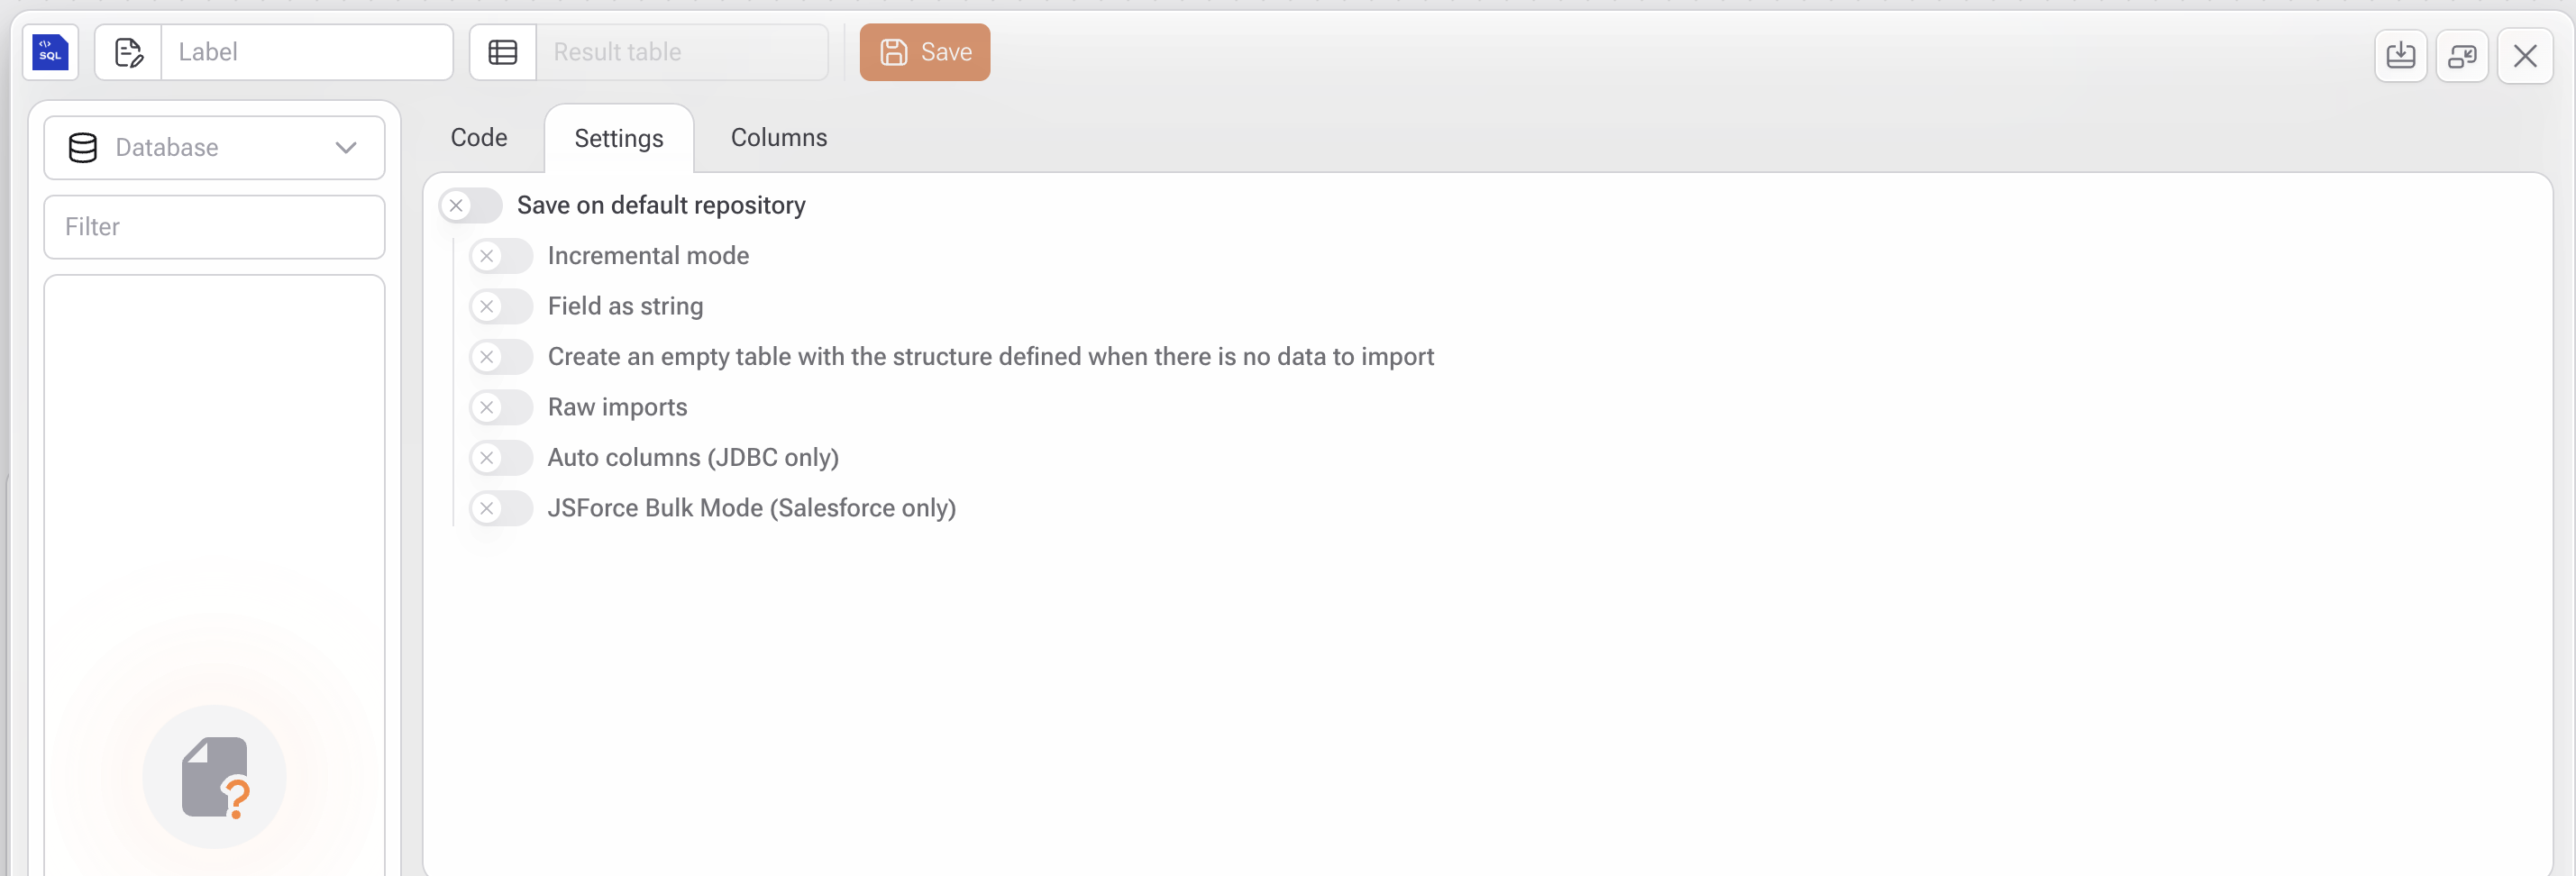
### **4. Settings (Settings Tab)**

<figure><img src="/files/UjinoAfoWA0cbmCWQSAO" alt=""><figcaption></figcaption></figure>

* **Save on default repository:** Saves the query result as a table in the project’s local repository.
* **Incremental mode:** Only imports new records when applicable.
* **Field as string:** Converts all fields to text.
* **Create an empty table when no data:** Creates the table structure even if the query returns no data.
* **Raw imports:** Imports data without automatic formatting.
* **Auto columns (JDBC only):** Automatically detects column structure (JDBC connections only).
* **JSForce Bulk Mode (Salesforce only):** Optimizes performance for bulk imports from Salesforce.

{% hint style="warning" %}
These options are especially useful for managing schema and performance in external database integrations.
{% endhint %}

***

### **5. Columns Tab**

* This tab becomes available only if **Save on default repository** is enabled.
* Manually define column names and types for the resulting table if you don’t want them to be automatically detected.

***

### **6. Save and Run**

* Click **Save** to add the task to your flow.
* You can then link this step to additional tasks (such as transformation, visualization, or export).

***

#### &#x20;Use Cases

* Querying live data from an external source (e.g., MySQL, PostgreSQL, Oracle, SQL Server)
* Importing legacy system or ERP data via SQL
* Transforming data before ingestion directly through SQL
* Automating integrations with enterprise databases using custom queries


# Insert Table

<figure><img src="/files/lNSr4dcR8PRcf7k6Cicl" alt=""><figcaption></figcaption></figure>

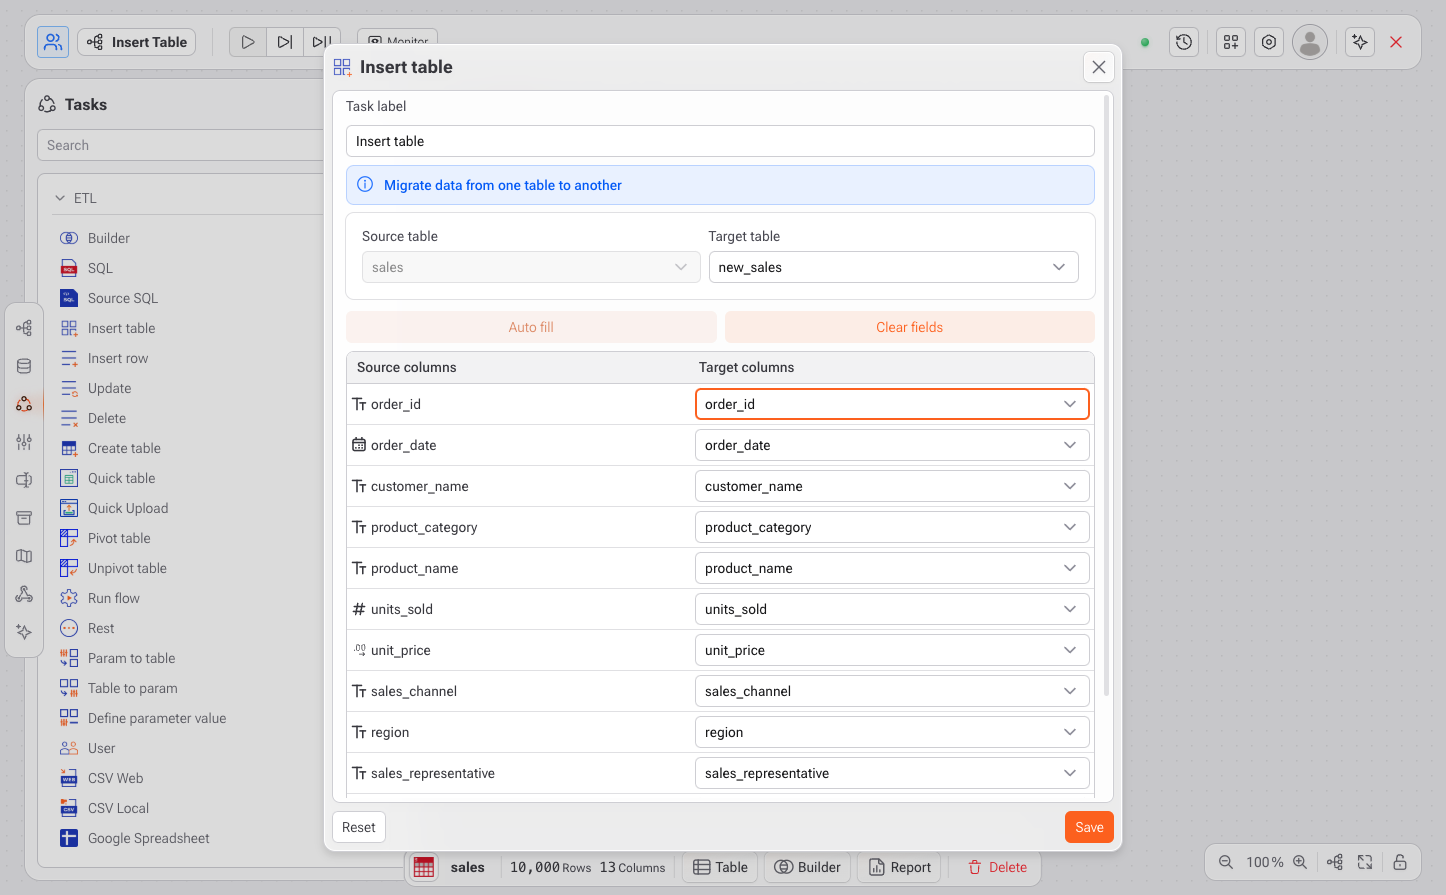
The **Insert Table** task in Gaio DataOS allows you to **copy or migrate data** from one table to another.\
It is especially useful for building ETL processes, versioning datasets, or consolidating information from multiple sources.

***

## How to Use

Follow the steps below to insert data from a source table into a target table:

***

### 1. **Open the Insert Table Task**

* In the **Studio**, go to the **Tasks** panel.
* Under the **ETL** section, select **Insert table**.

***

### 2. **Define Source and Target Tables**

* **Source Table**: Choose the table from which the data will be extracted (e.g., `sales`).
* **Target Table**: Select or type the name of the table where the data should be inserted (e.g., `new_sales`).

If the target table does not exist, you must create it beforehand using the **Create Table** task.

***

### 3. **Map Columns**

* The system will automatically try to match columns by name.
* You can:
  * Use **Auto fill** to quickly populate matching fields.
  * Adjust each **Source column → Target column** mapping manually using the dropdowns.
  * Use **Clear fields** to reset all mappings.

{% hint style="warning" %}
Ensure data types are compatible to avoid insertion errors.
{% endhint %}

***

### 4. **Review and Save**

* After mapping all necessary columns:
  * Click **Save** to store the task.
  * Or **Save and run** (if available) to execute the task immediately.

***

#### Use Cases

* Syncing data between tables in a flow
* Creating clean copies of working datasets
* Backing up raw data before transformations
* Aggregating or partitioning records

***

#### Best Practices

* Use descriptive task labels to identify the insert operation in your flow.
* Always validate column mappings before running the task.
* Combine with filtering or transformation steps if needed before insertion.


# Insert Row

<figure><img src="/files/OiQPrmepTgfukj9GWZhZ" alt=""><figcaption></figcaption></figure>

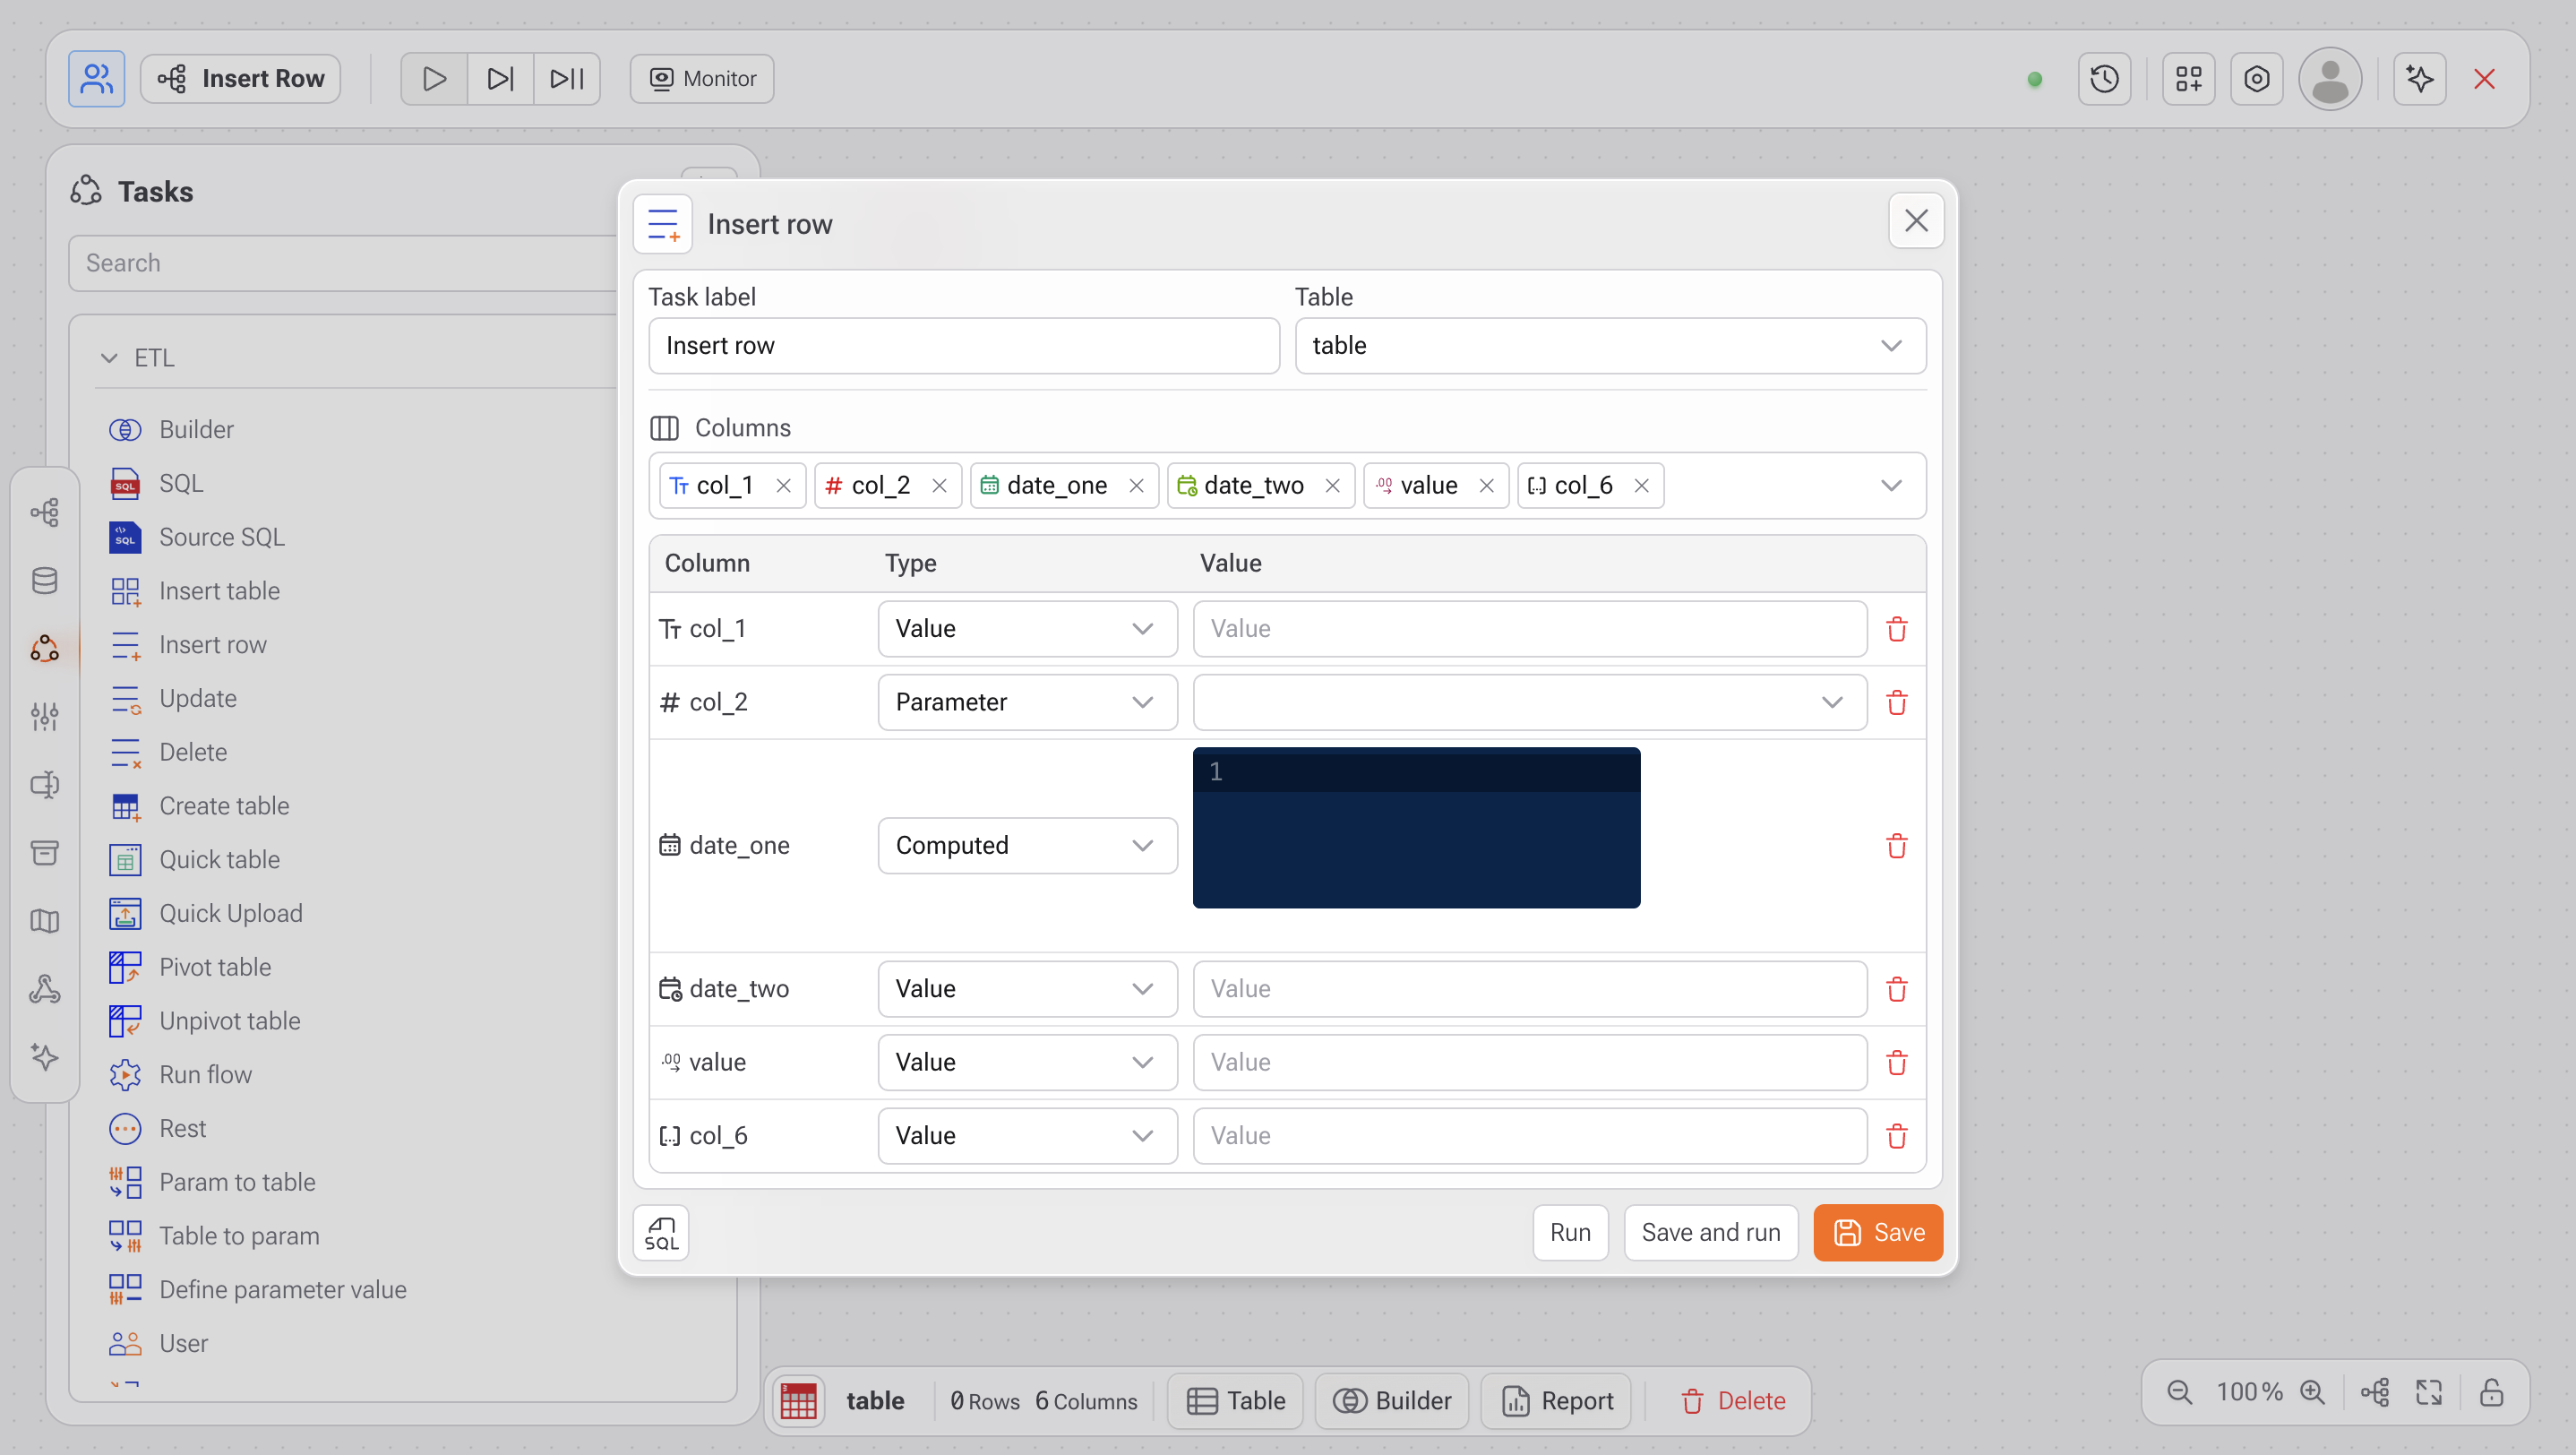
The **Insert Row** task in **Gaio DataOS** allows you to manually insert a new row into an existing table. It is especially useful for adding static records, parameterized values, or dynamic data generated through formulas or computed fields.

***

## &#x20;How to Use

### **1. Open the Task**

* In the **Studio**, go to the left menu and navigate to:\
  **Tasks > ETL > Insert Row**

***

### **2. Fill Out Basic Information**

* **Task label**: (optional) Provide a name for this task within your flow.
* **Table**: Select the **target table** where the new row will be inserted.

***

### **3. Select Columns**

* In the **Columns** field, choose which columns you want to populate.
* After selecting, a list of input fields will be displayed below for each column.

***

### **4. Define Type and Value for Each Column**

For each selected column, configure the following:

**Type:** Choose the input type:

* `Value`: insert a fixed/static value (e.g., "Product A", 123)
* `Parameter`: use a previously defined project parameter
* `Computed`: define a formula or function (e.g., `now()`, `today()`, `1+1`) |

**Value:** Enter the corresponding value based on the type selected.&#x20;

**Examples:**

* `col_1`: Type = `Value`, Value = `"New Client"`
* `col_2`: Type = `Parameter`, Value = `@client_id`
* `date_one`: Type = `Computed`, Value = `today()`

***

### **5. Execute or Save**

* **Run**: Runs the task without saving it to the flow.
* **Save**: Saves the task for use in the current flow without executing it.
* **Save and Run**: Saves and immediately runs the task.

***

#### Use Cases

* Manually insert a single row into a table
* Log events or markers during execution
* Populate test values during flow development
* Use computed fields for timestamps, UUIDs, or calculated values


# Update

<figure><img src="/files/EboLkTVWKf9C4AaDpUQq" alt=""><figcaption></figcaption></figure>

The **Update** task in **Gaio DataOS** allows you to modify existing records in a table based on custom filter conditions. This is ideal for correcting data, applying transformation rules, or dynamically synchronizing values during ETL flows.

{% hint style="warning" %}
&#x20;**Important:** This task can only be used when a table is selected in the flow. Be sure to add and connect a Table before configuring the update.
{% endhint %}

***

## &#x20;How to Use

### **1. Insert and Select a Table Block**

* Add a **Table** to your flow and choose the dataset you want to work with.
* The Update task will only become available once a table is selected.

***

### **2. Open the Update Task**

* In the left-hand menu, go to:\
  **Tasks > ETL > Update**

***

### **3. Configure Basic Info**

* **Task label**: (optional) Add a name for the task to identify it in your flow.
* **Table**: The table should be automatically linked from your selected block (e.g., `new_sales`).

***

### **4. Select Columns to Update**

* In the **Columns** section, choose the fields you want to update.
* For each selected column, define:

**Type:** Defines how the new value will be set:

* `Value`: Static input
* `Parameter`: Uses a predefined variable
* `Computed`: Accepts formulas (e.g., `now()`, `1 + 1`) |

**Value:** Enter the new value or expression

***

### **5. Set Filter Conditions**

* In the **Filters** section, specify which records should be updated.
* For each filter:

| Field        | Description                                         |
| ------------ | --------------------------------------------------- |
| **Column**   | Select the column to filter by                      |
| **Type**     | Input type (e.g., `Value`, `Parameter`)             |
| **Operator** | Comparison logic (e.g., `Equal to`, `Greater than`) |
| **Value**    | The value to match                                  |

Example:\
Update the `order_date` only where `order_id = 1001`.

{% hint style="warning" %}
**Important:** If there are no filters, all rows in the table will be updated.
{% endhint %}

***

### **6. Execute or Save**

* **Run**: Immediately executes the update (one-time).
* **Save**: Saves the configuration to your data flow.
* **Save and Run**: Saves and executes the update at once.

***

#### Use Cases

* Correct outdated or incorrect values
* Apply standardization rules (e.g., replace empty values)
* Use dynamic inputs via parameters
* Update timestamps or statuses during automated flows


# Delete

<figure><img src="/files/er1uBOBa0JguLJChOMKw" alt=""><figcaption></figcaption></figure>

The **Delete** task in **Gaio DataOS** allows you to remove records from a table based on custom filter conditions. It is useful for cleaning outdated, inconsistent, or temporary data as part of automated ETL flows.

{% hint style="warning" %}
**Important:** This task can only be used when a table is selected in the flow. Be sure to add and connect a Table before configuring the deletion.
{% endhint %}

***

## How to Use

### **1. Add and Select a Table Block**

* In your flow, add a **Table** with the dataset you want to work with.
* Select the table as input for the Delete task.

***

### **2. Open the Delete Task**

* In the left-side menu, go to:\
  **Tasks > ETL > Delete**

***

### **3. Fill Out Task Information**

* **Task label**: (optional) A descriptive name for the step.
* **Table**: Will be automatically filled based on the selected table (e.g., `new_sales`).

***

### **4. Set Filter Conditions**

* In the **Filters** section, define one or more conditions to specify **which rows should be deleted**.
* For each filter, configure:

| Field        | Description                                                            |
| ------------ | ---------------------------------------------------------------------- |
| **Column**   | Choose the column to filter by (e.g., `order_id`)                      |
| **Type**     | Input type: `Value`, `Parameter`, etc.                                 |
| **Operator** | Comparison operator (`Equal to`, `Not equal to`, `Greater than`, etc.) |
| **Value**    | The value to compare against                                           |

**Example:**\
Delete rows from the `new_sales` table where `order_id` is equal to `1001`.

***

### **5. Execute or Save**

* **Run**: Immediately performs the deletion (without saving the task).
* **Save**: Saves the task to the current flow.
* **Save and Run**: Saves and immediately executes the deletion.

***

#### Use Cases

* Remove invalid or duplicate records
* Delete temporary test data
* Automate cleanup logic based on business rules
* Ensure data consistency before or after processing

***


# Create Table

<figure><img src="/files/NIq2fZWaWzWDuoElOotc" alt=""><figcaption></figcaption></figure>

The **Create Table** task in Gaio DataOS allows you to define and generate a new table structure directly within your data project. This is essential for creating intermediate or final storage layers in your data pipelines.

***

## &#x20;How to Use

Follow the steps below to create a new table manually:

***

### 1. **Open the Create Table Task**

* Go to the **Studio**, and in the left panel under **Tasks > ETL**, click on **Create Table**.

***

### 2. **Define the Task and Table Name**

* **Task label**: (optional) Provide a name for this creation step for easy identification in your flow.
* **Result table**: Type the name of the table you want to create.

***

### 3. **Add Columns**

Use the grid interface to define each column's structure:

| Field       | Description                                                                                       |
| ----------- | ------------------------------------------------------------------------------------------------- |
| **Column**  | Enter the name of the column (e.g., `col_1`, `date_one`, `value`).                                |
| **Type**    | Select the data type (e.g., `String`, `Int64`, `Date`, `DateTime`, `Float64`, `Array`).           |
| **Default** | (Optional) Set a default value (e.g., `today()`, `now()`, or a static value like `0` or `"N/A"`). |

To add a column, use the `+` button. To remove a column, click the trash icon 🗑️.

***

### 4. **Optional: Drop Existing Table**

* Enable the **Drop table** checkbox if you want to overwrite a table with the same name&#x20;

{% hint style="warning" %}
This deletes the existing data).
{% endhint %}

***

### 5. **Execute or Save**

* **Execute**: Creates the table immediately.
* **Save**: Stores the task for later execution in the flow.
* **Save and Execute**: Runs the operation and keeps it registered in the pipeline.

***

#### &#x20;Best Practices

* Always double-check the **Drop table** option — use it only when you’re sure the previous data can be deleted.
* Use **default values** for timestamps or standard values where needed.
* Combine this task with **Insert Table**, **Transformations**, and **Automations** for end-to-end data pipelines.


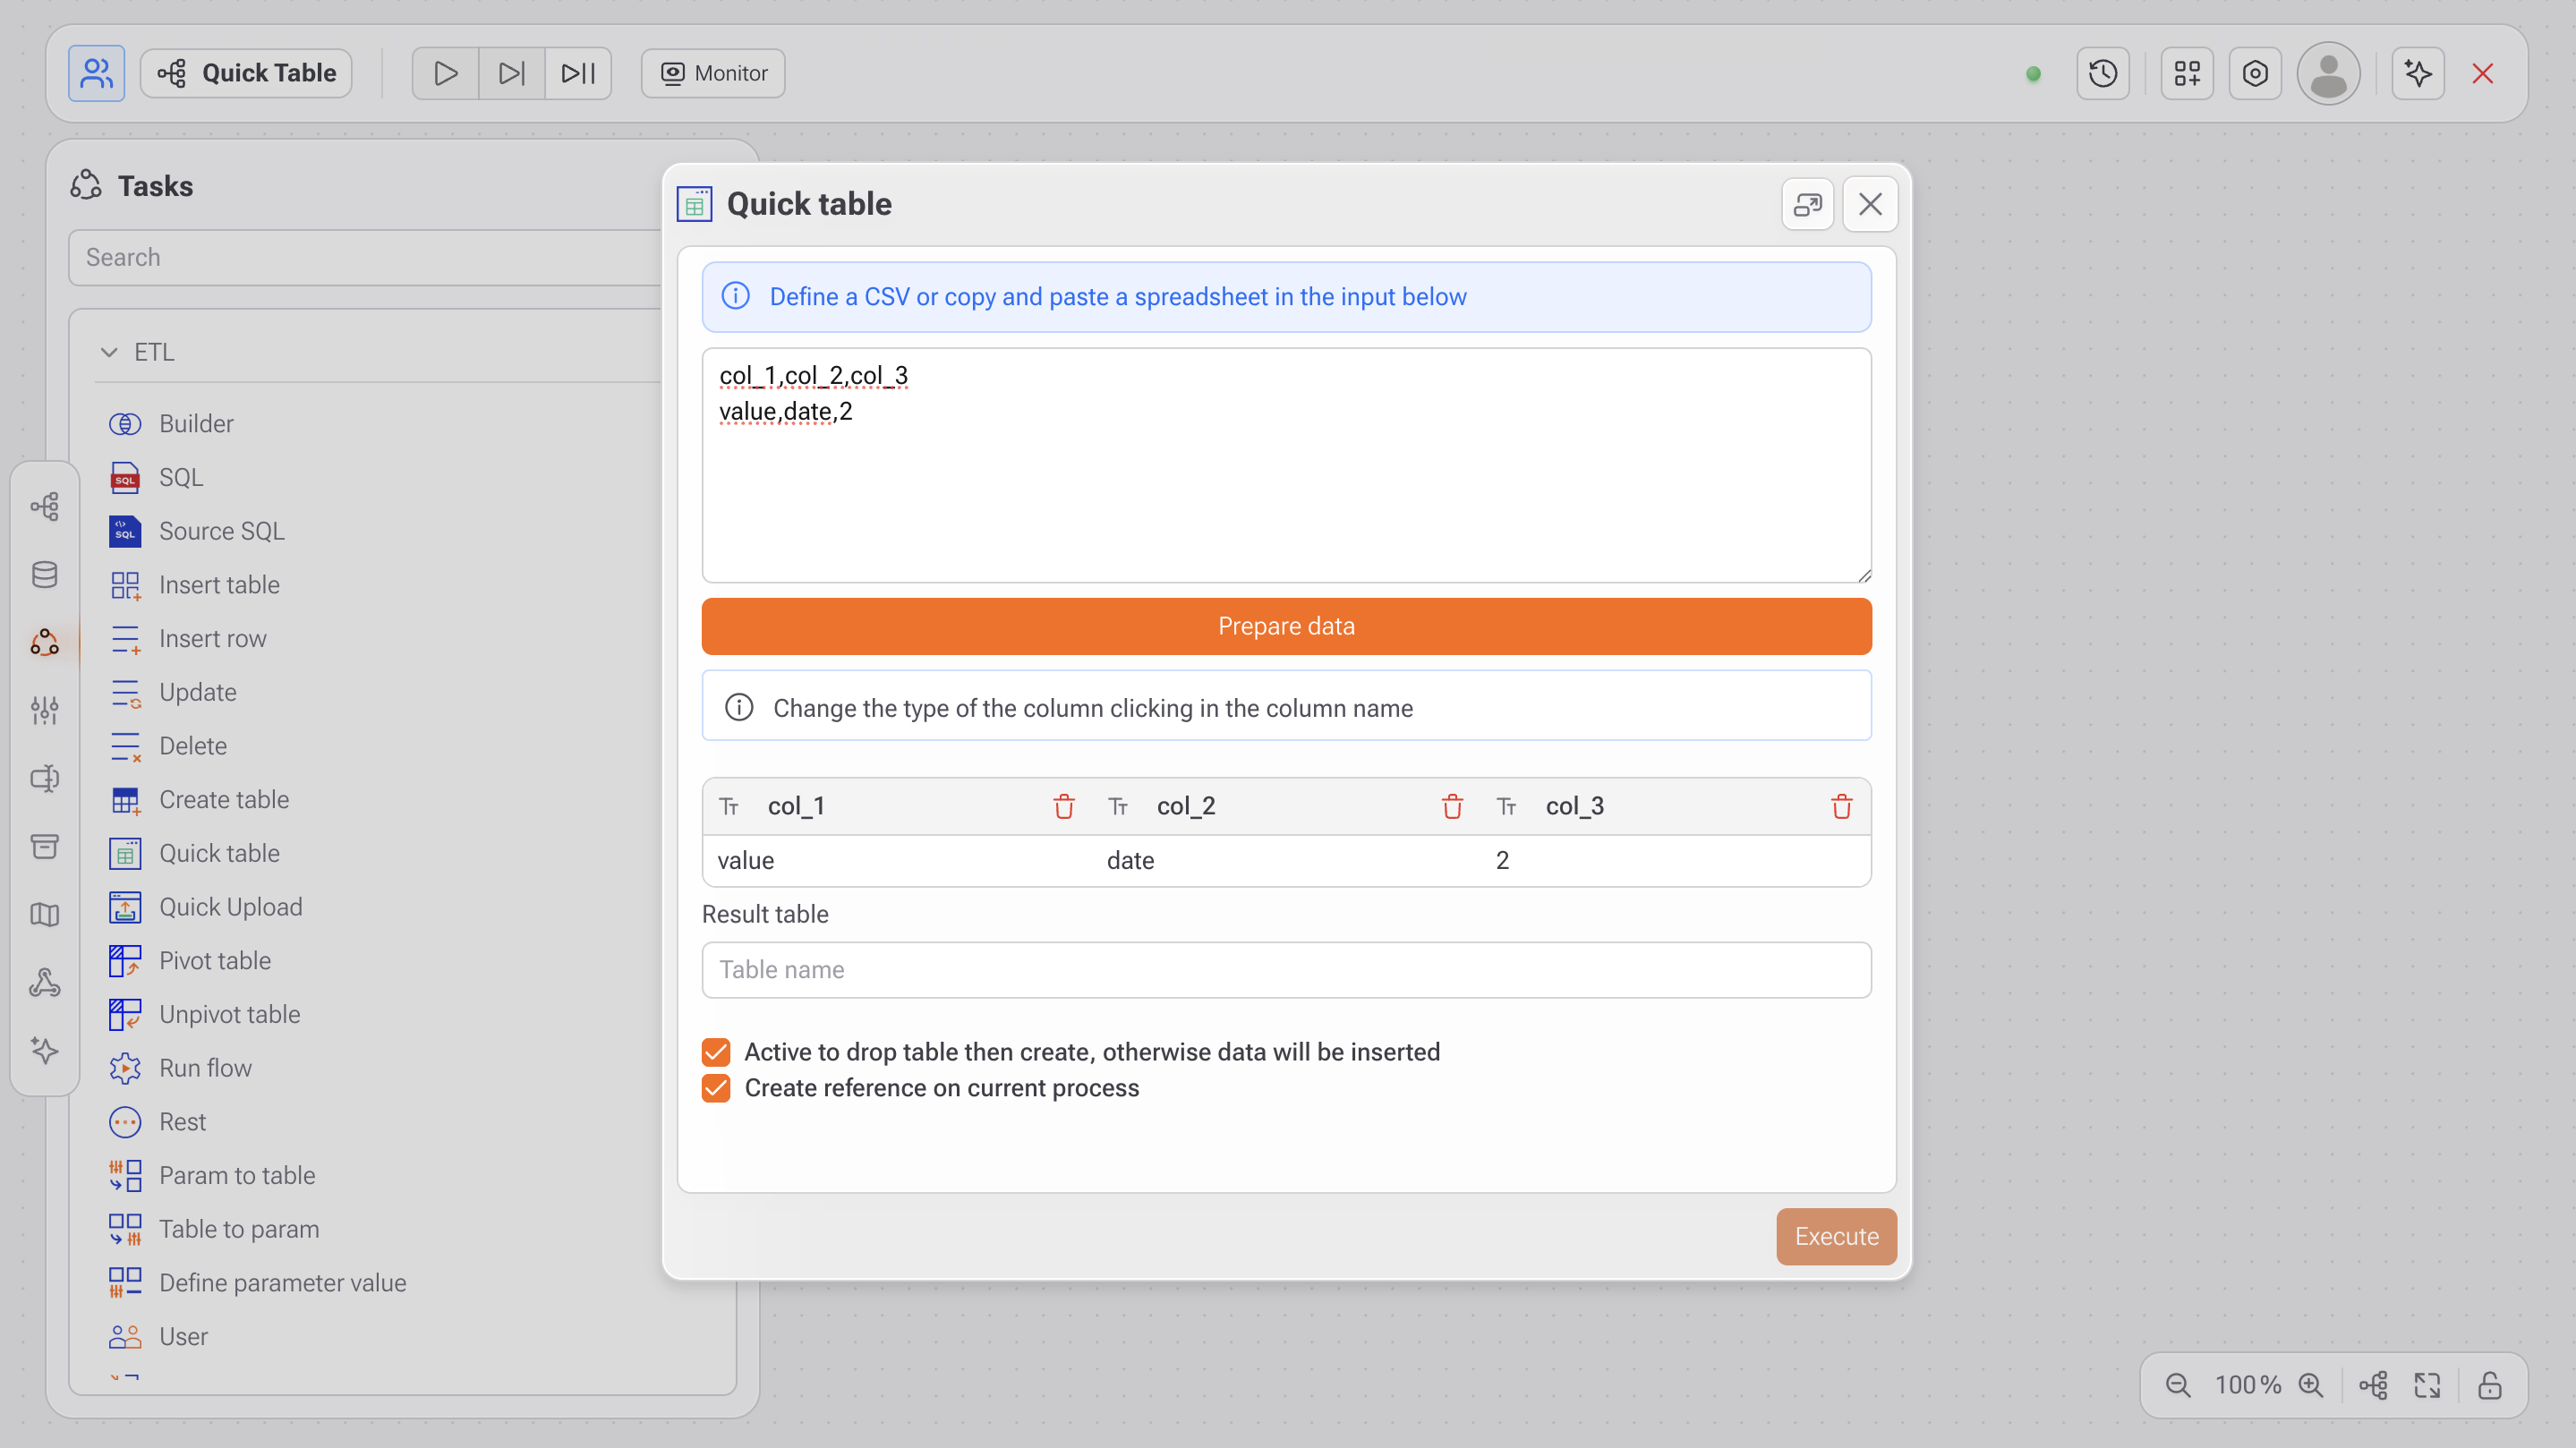
# Quick Table

<figure><img src="/files/uq87l1Q1kqHWghtFKrcF" alt=""><figcaption></figcaption></figure>

The **Quick Table** task in Gaio DataOS allows you to quickly create a table from small, manual data inputs — perfect for testing, prototyping, or entering reference values without uploading a full file.

***

## How to Use

Follow these steps to create a table from pasted data:

***

### 1. **Paste or Type Data**

* Use the input field at the top to enter your data in **CSV format**.
* The **first line** should contain the column headers.
* The **second line onward** should include the corresponding data rows.

**Example:**

```csv
col_1,col_2,col_3  
value,date,2
```

***

### 2. **Click “Prepare data”**

* This will parse your input and generate a data preview.
* Columns will be detected and their types automatically inferred.

***

### 3. **Adjust Column Types (Optional)**

* Click on a column header to manually change its data type:
  * `String`, `Int`, `Float`, `Date`, `DateTime`, etc.
* You can also **delete columns** using the trash icon.

***

### 4. **Set Table Options**

* **Result table**: Enter the name of the table you want to create.
* **Options:**
  * **Active to drop table then create**: If the table already exists, it will be dropped and recreated (use with caution).
  * **Create reference on current process**: Links the new table to the current data flow for further use.

***

### 5. **Execute**

* Click **Execute** to finalize the creation of the table and load the data.

***

#### Use Cases

* Create test datasets for development
* Add small reference tables manually
* Prototype transformations and visualizations
* Manually define mappings or constants


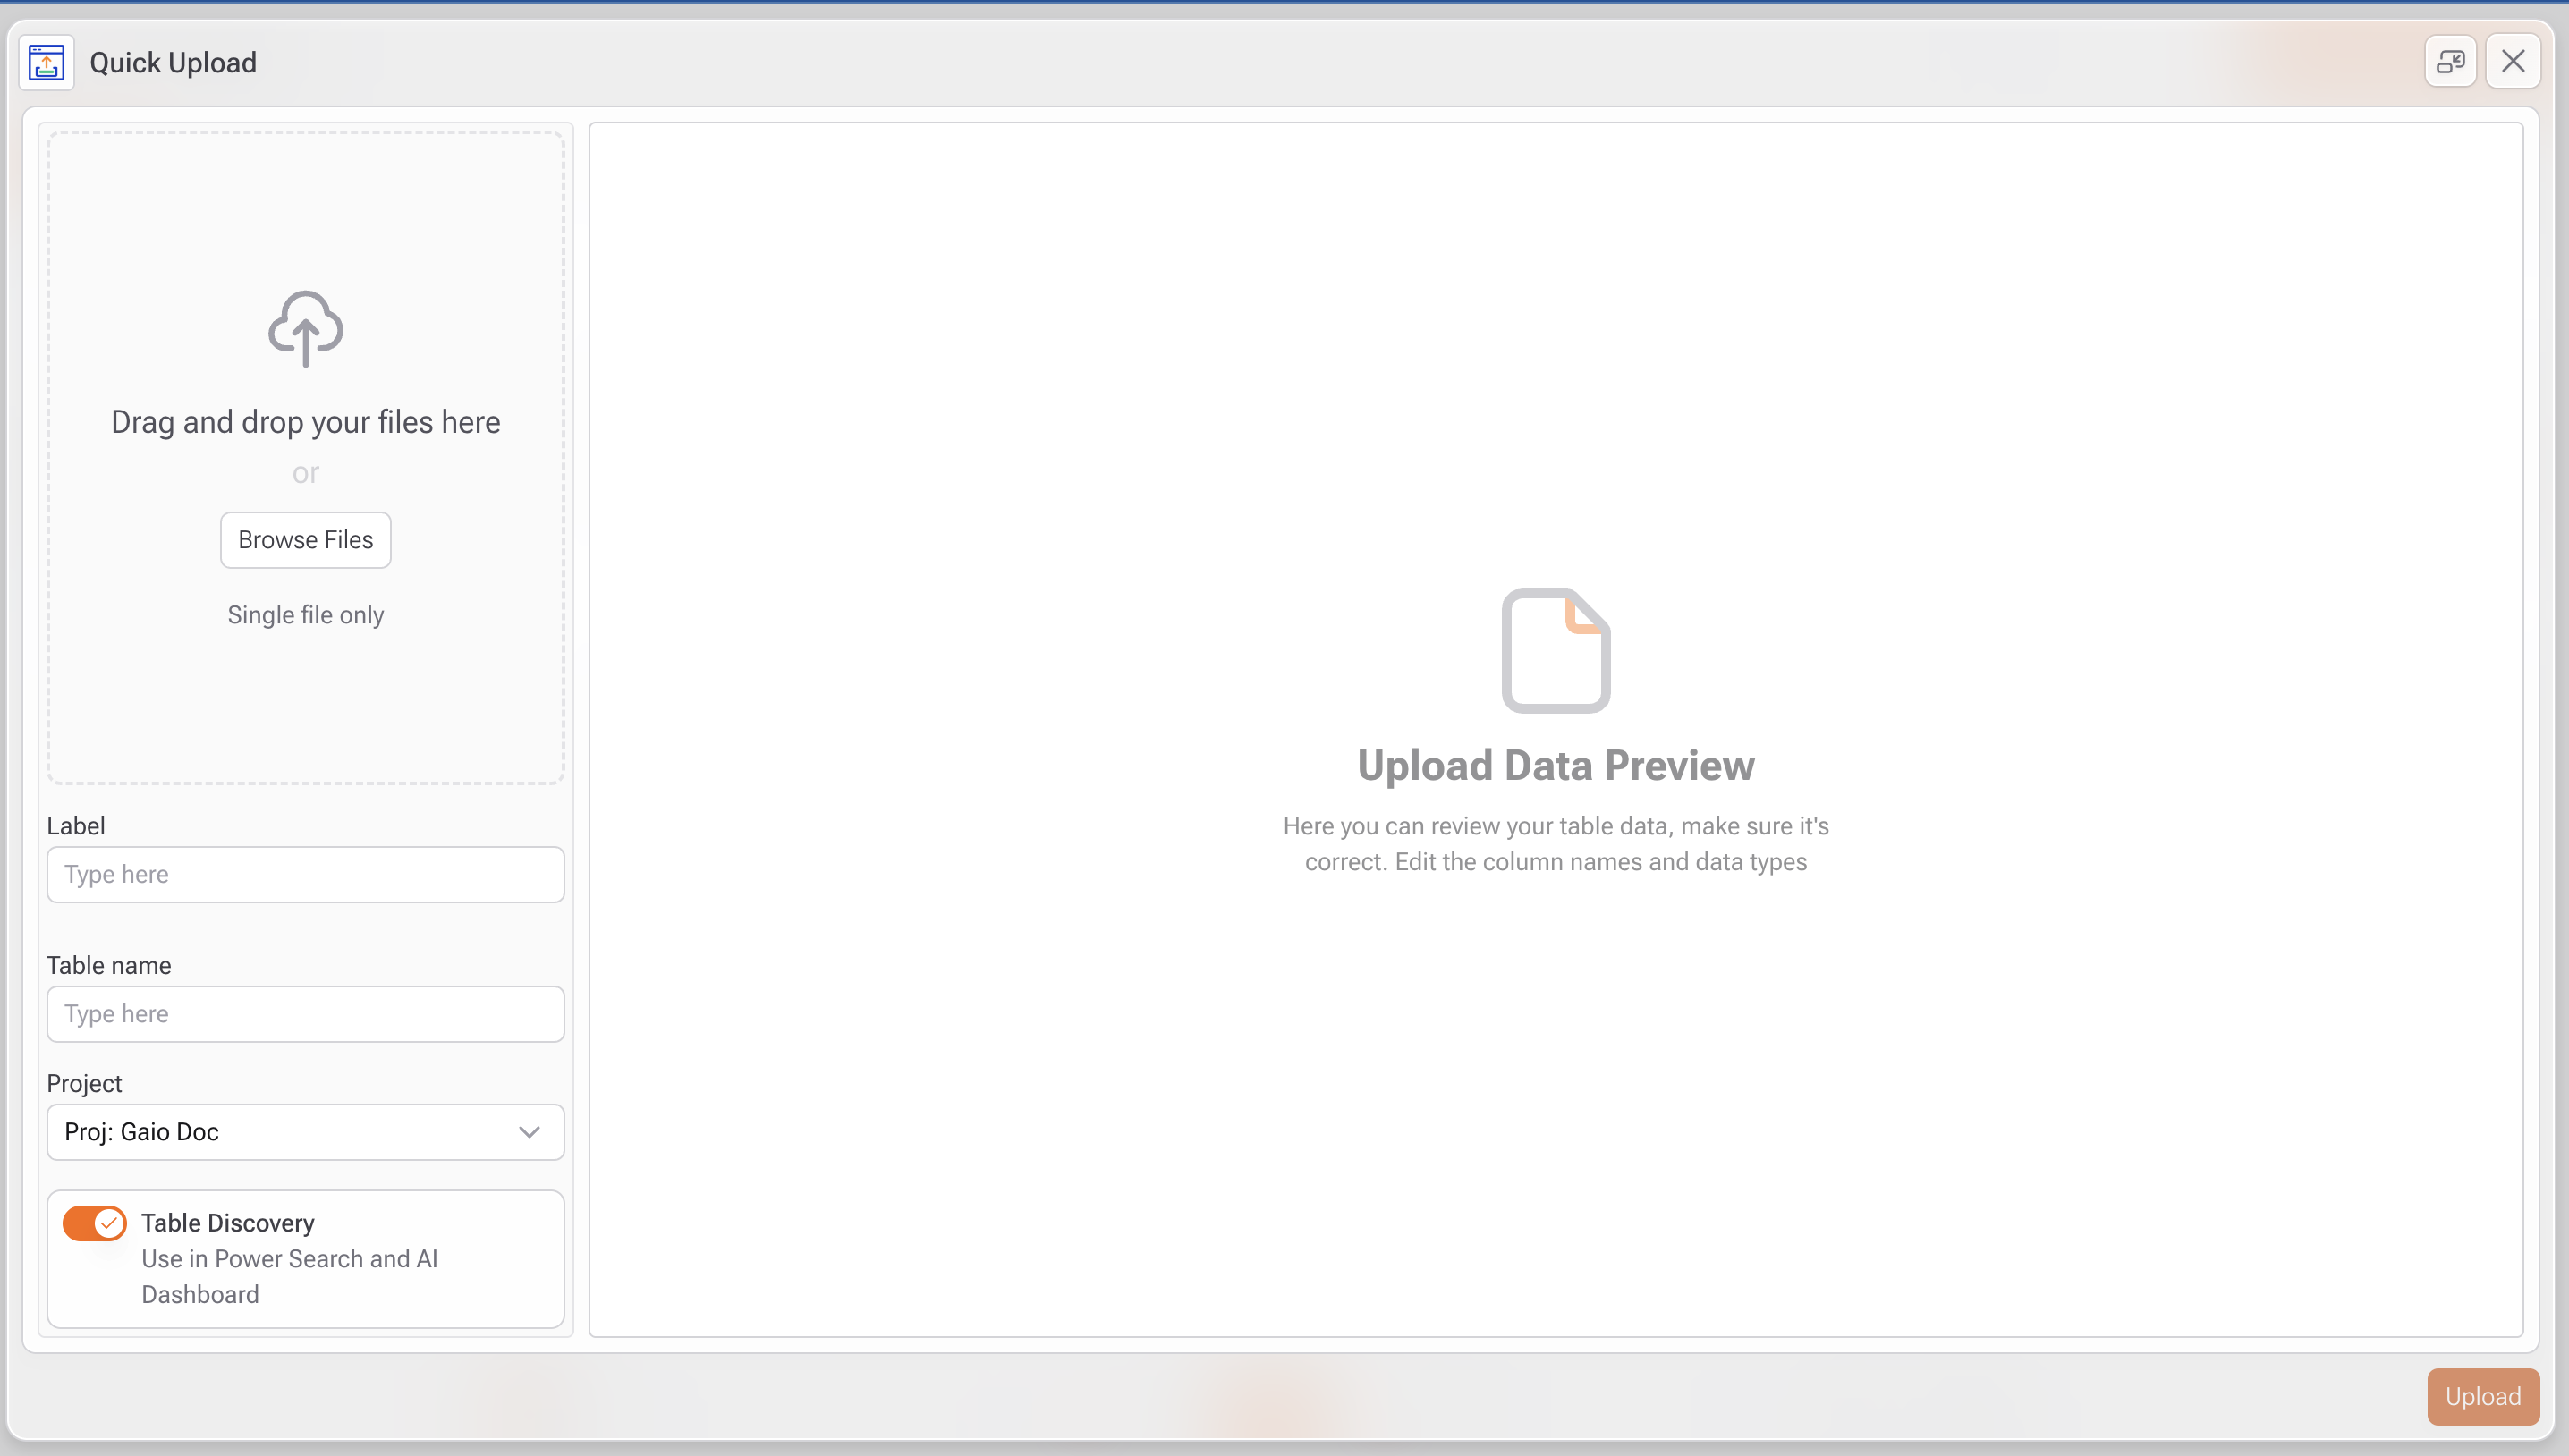
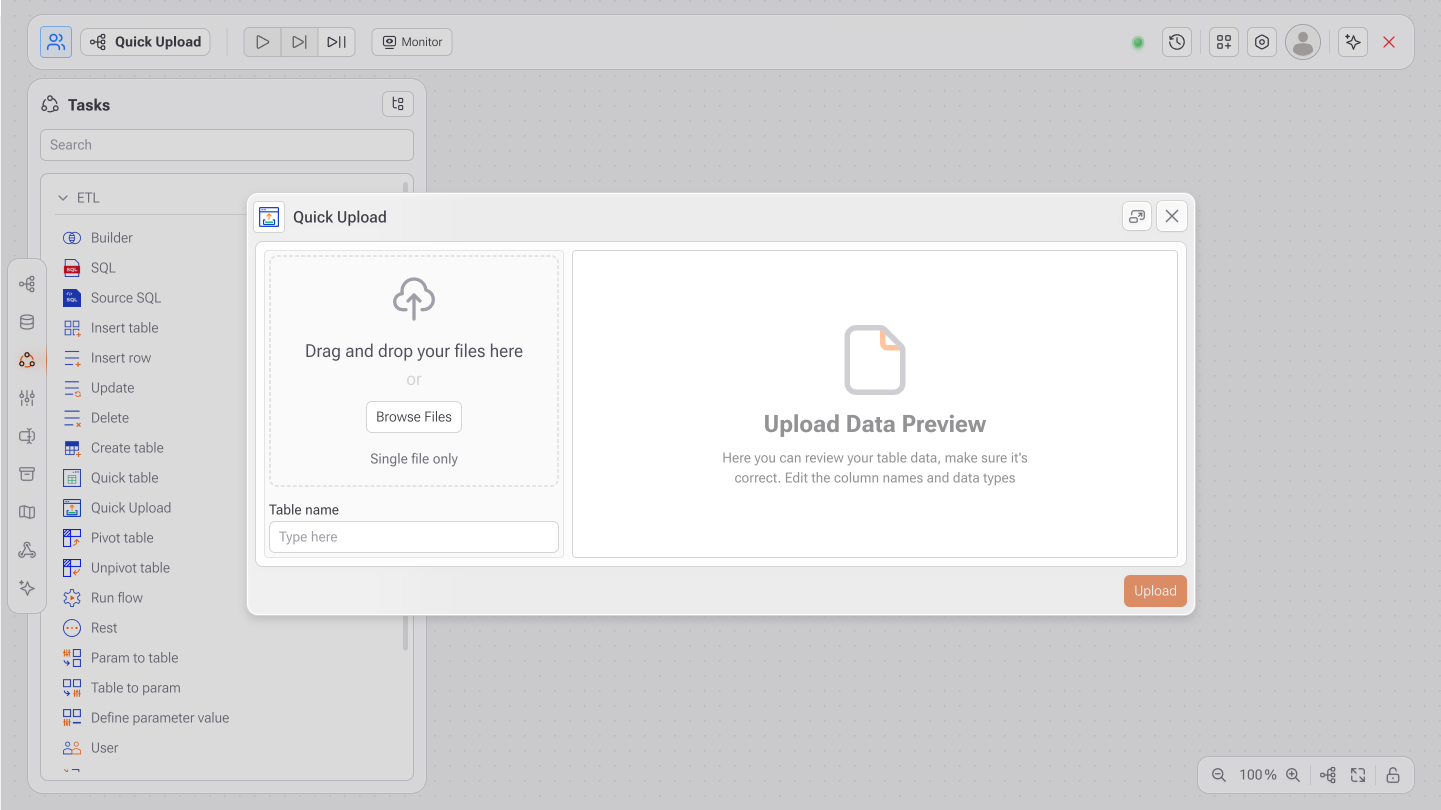
# Quick Upload

<figure><img src="/files/HYgmdWJDWk1IInea4lmP" alt=""><figcaption></figcaption></figure>

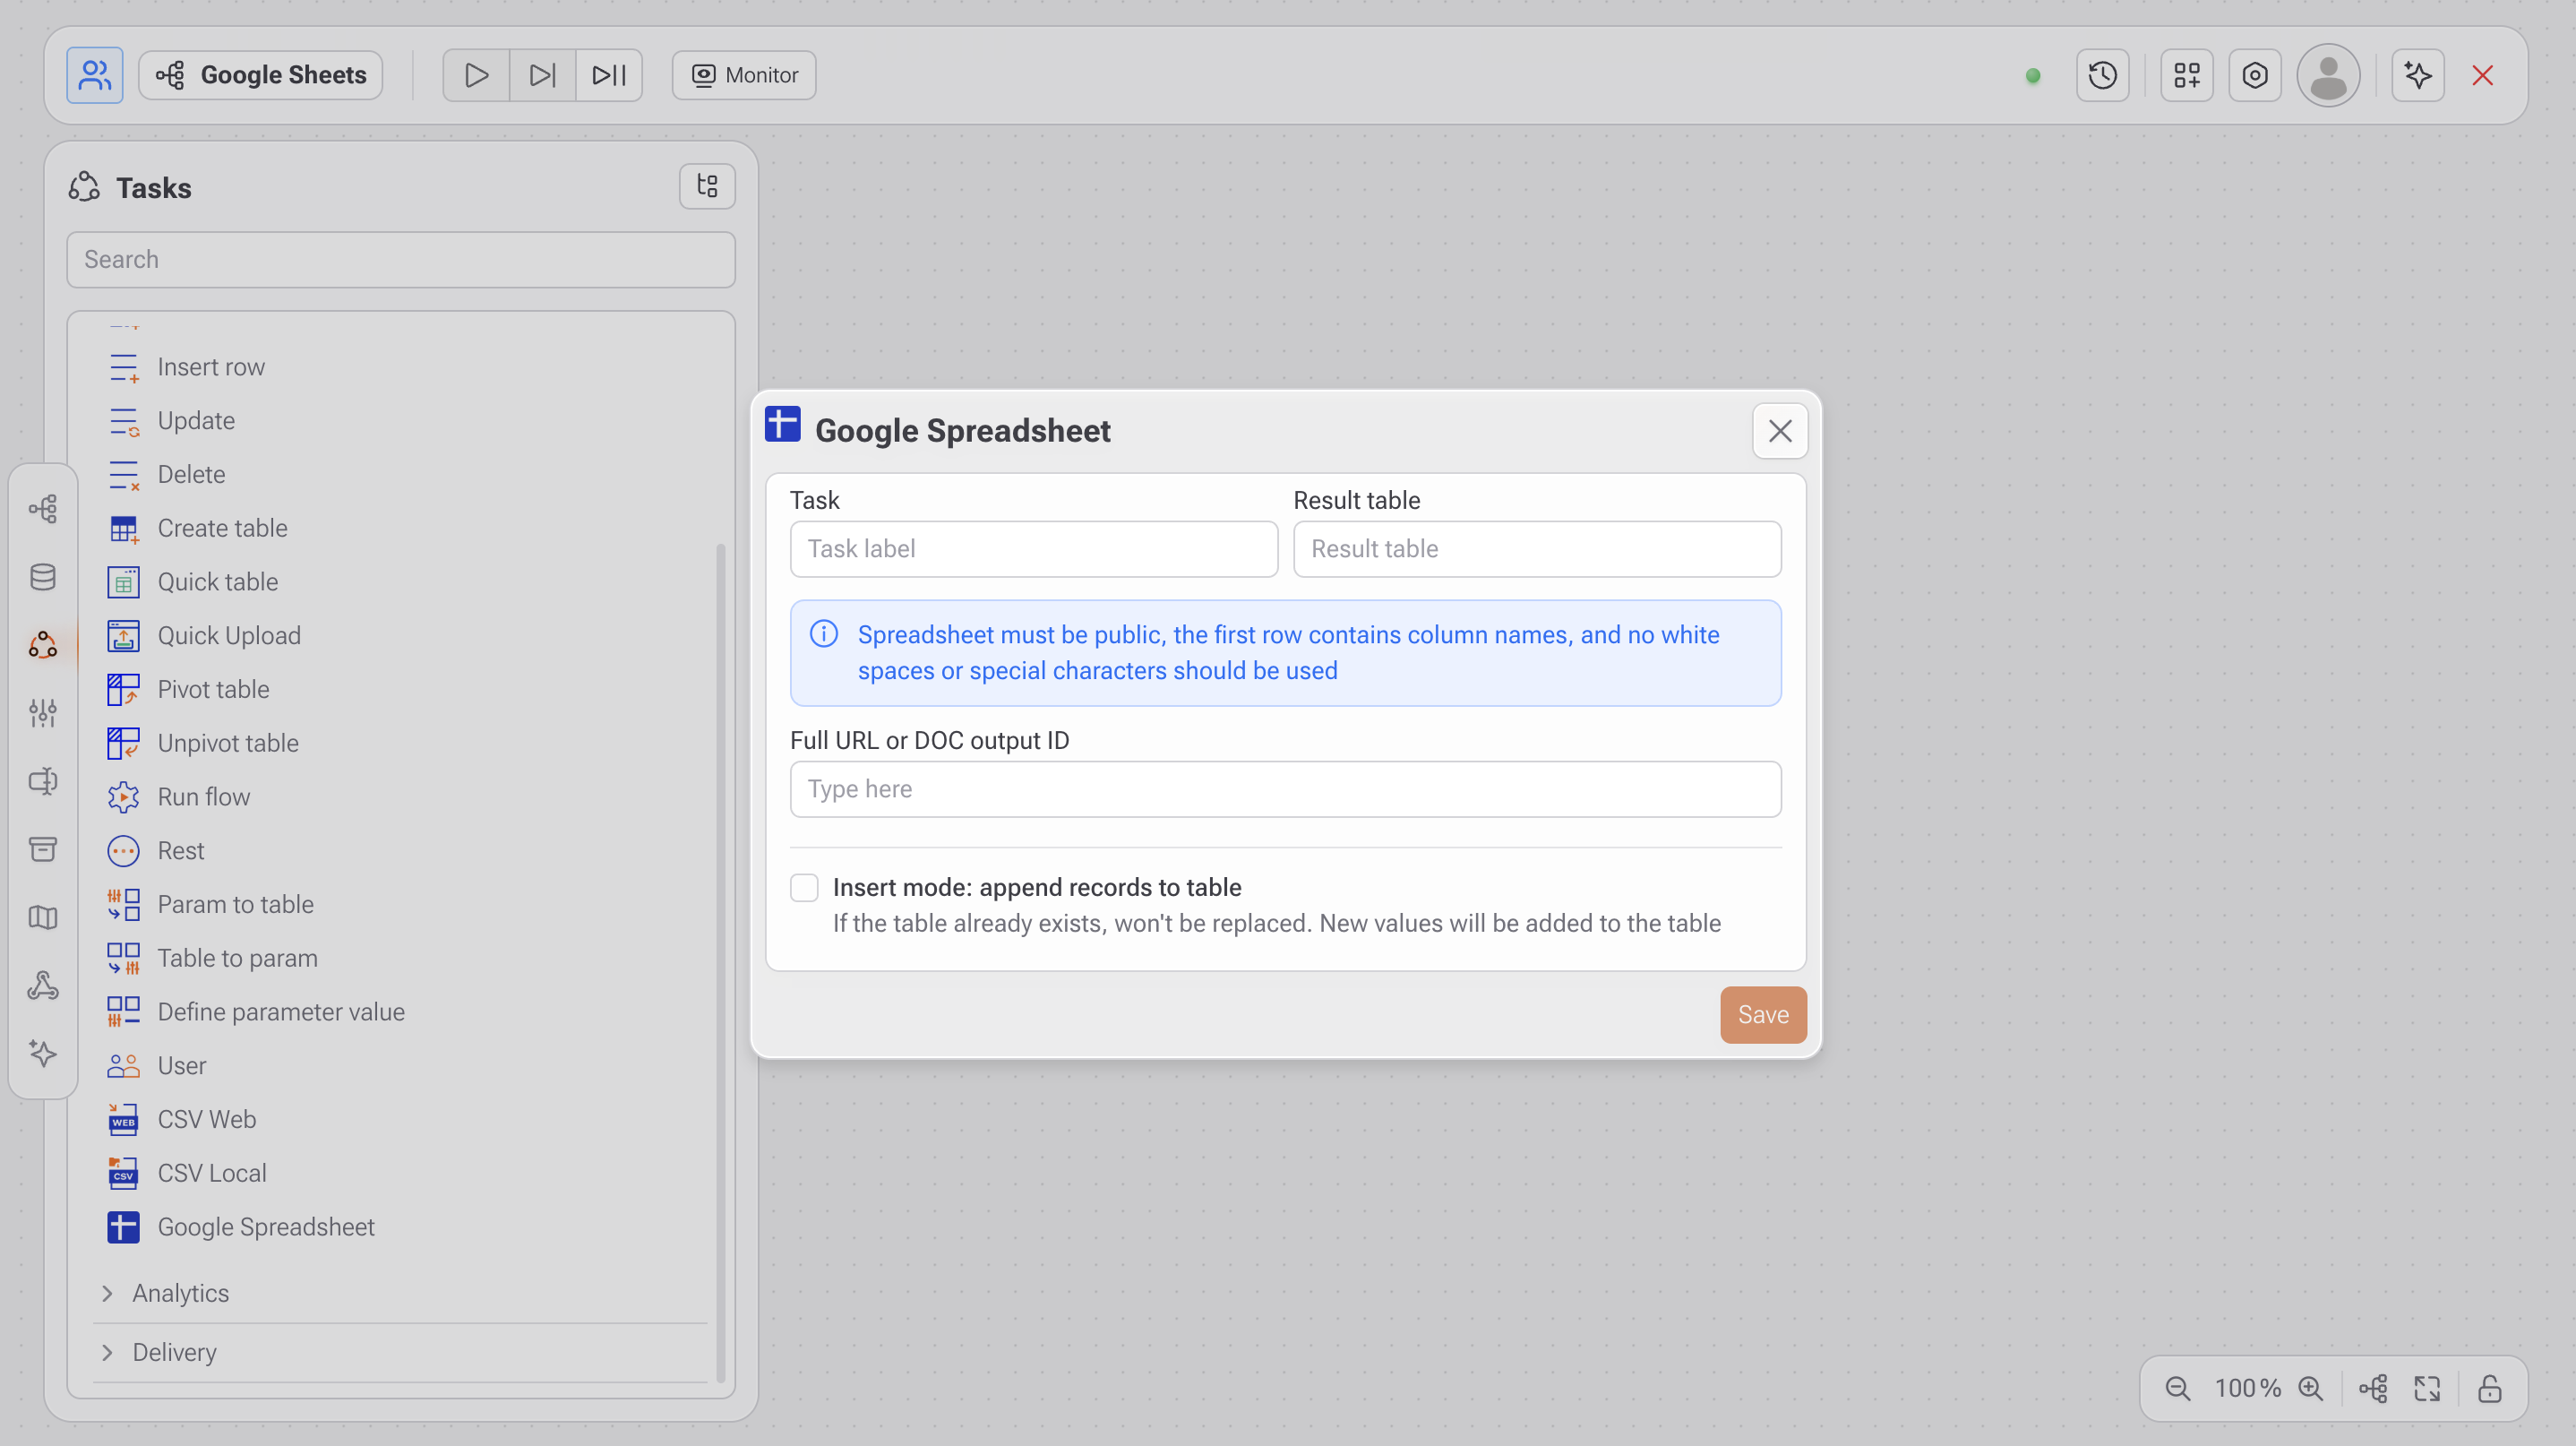
The **Quick Upload** feature in Gaio DataOS allows you to quickly import files like `.csv` and convert them into structured tables inside your project. With the redesigned interface, which includes two tabs — **Table** and **Columns** — the import process is now more intuitive, secure, and customizable.

***

## How to Use Quick Upload

***

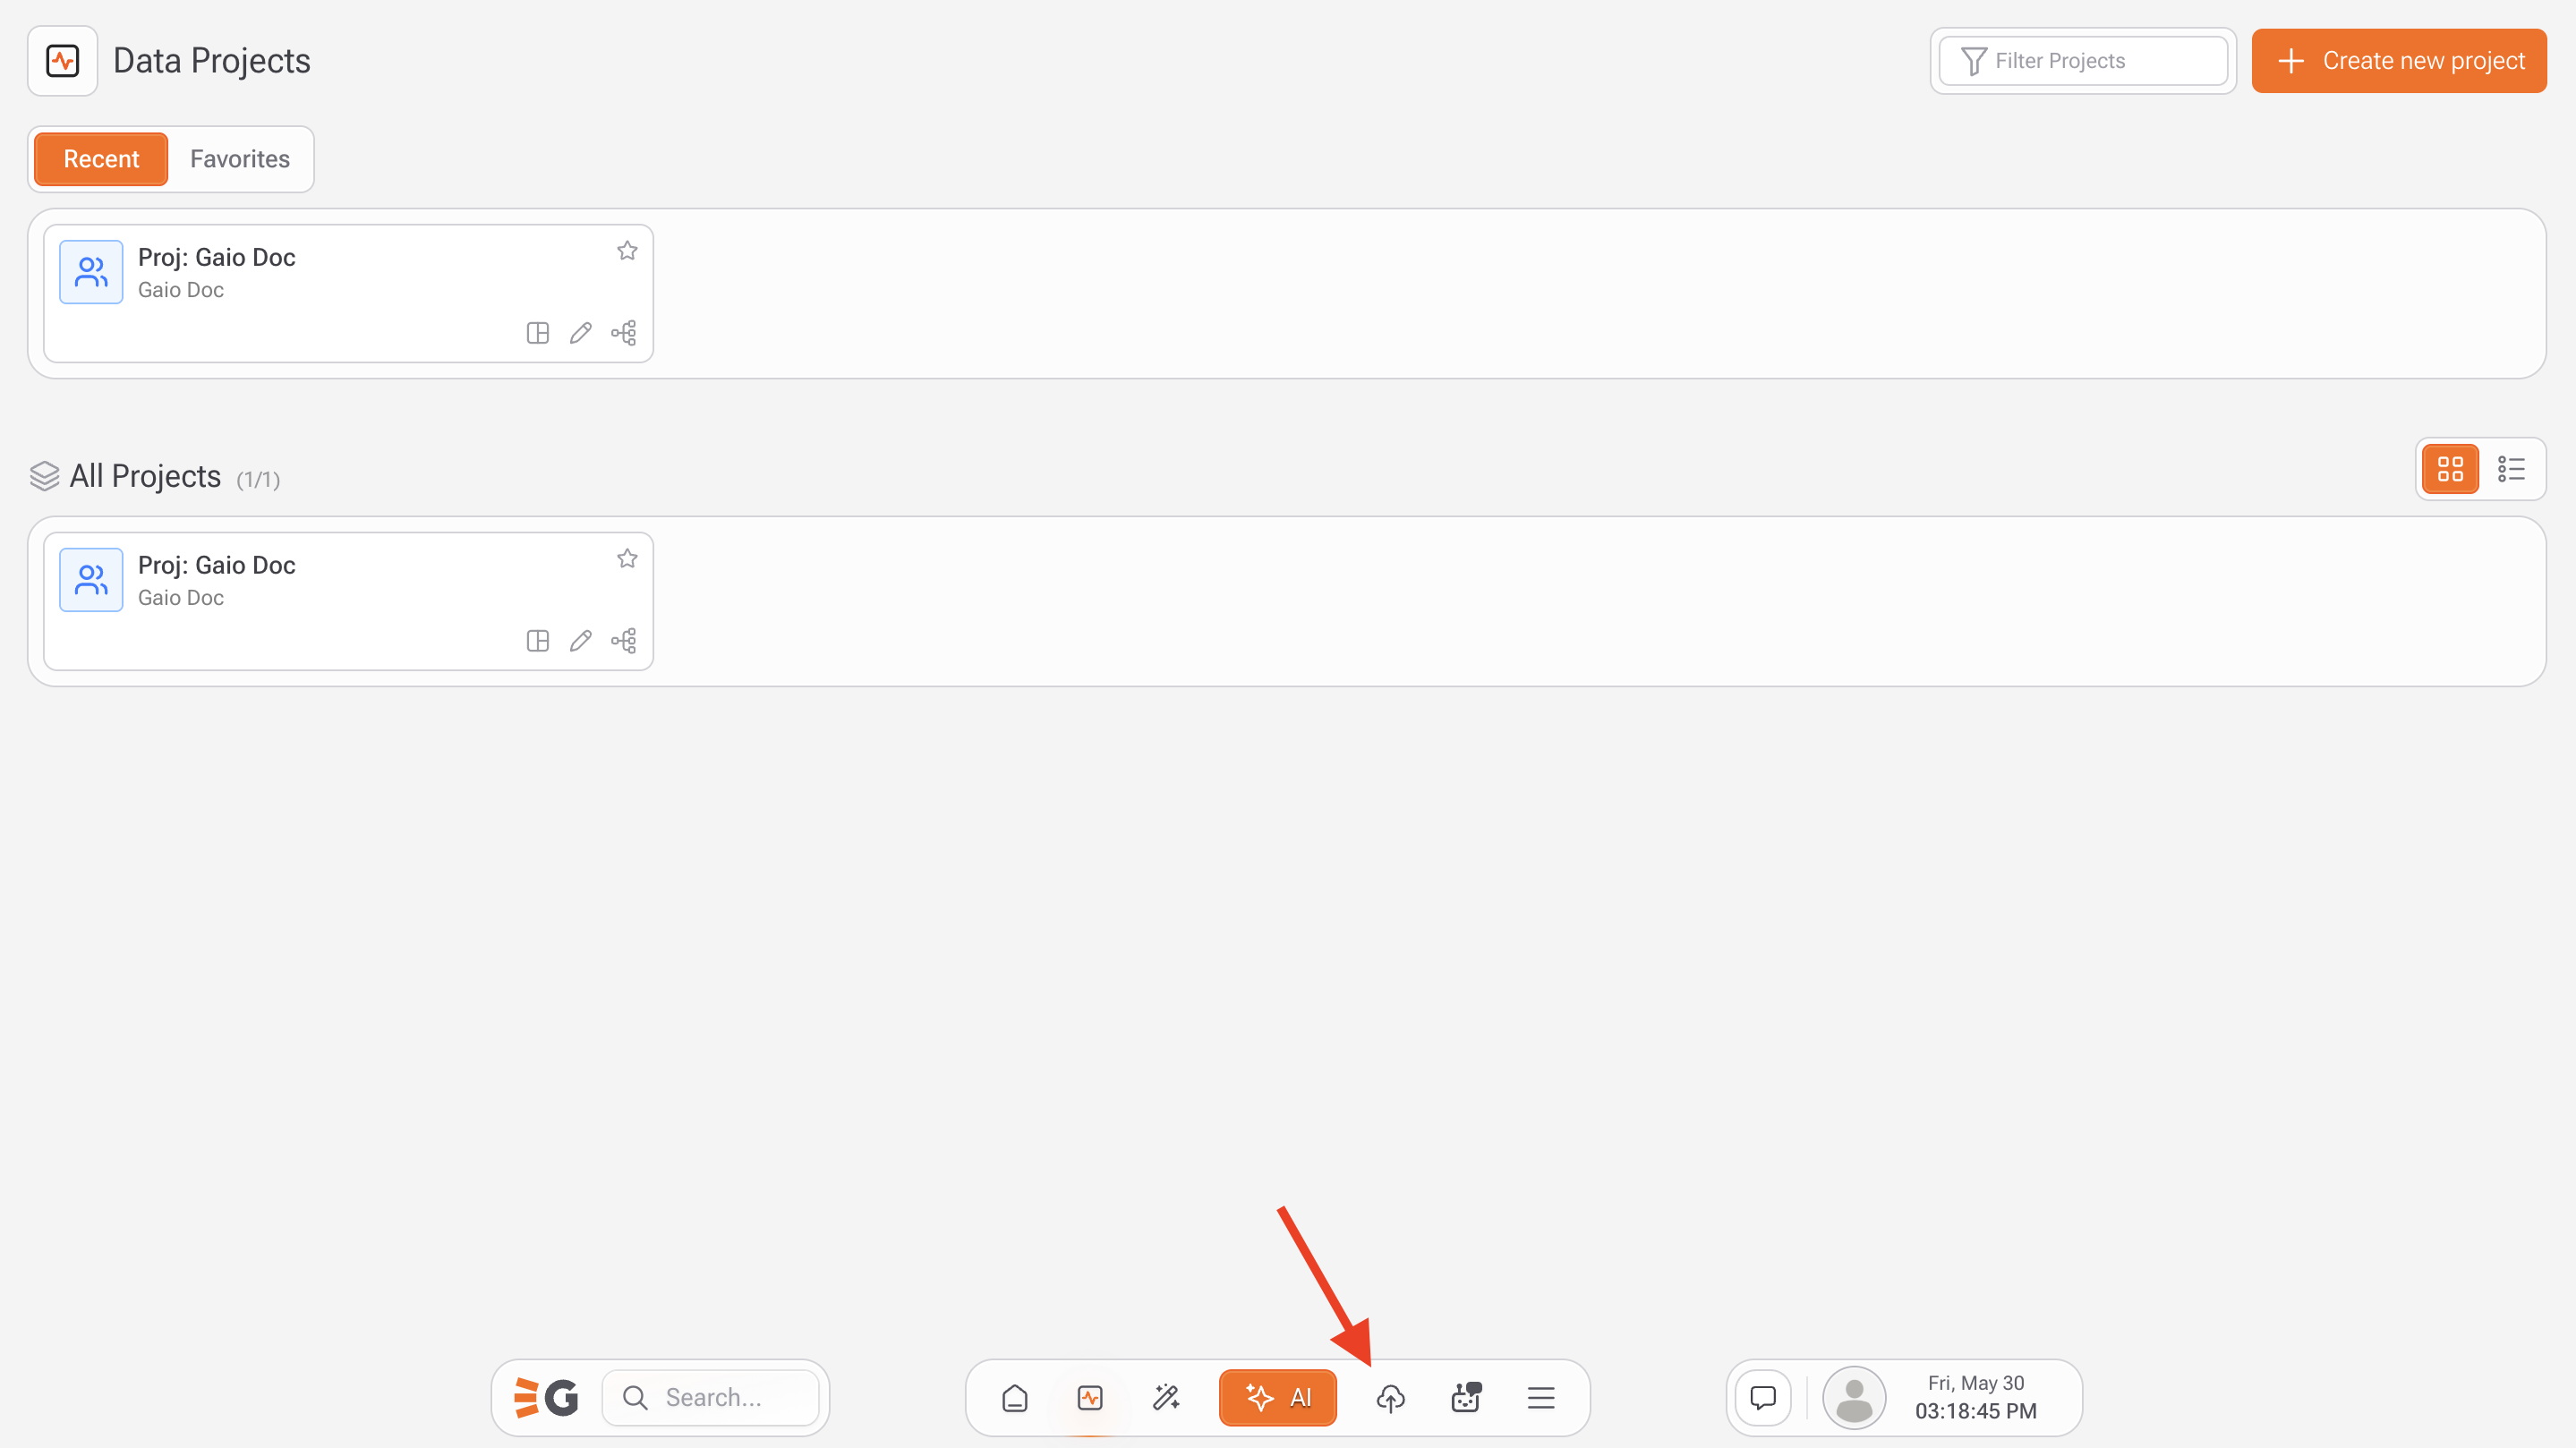
### 1. **Open the Quick Upload Panel**

* On your home bar, select quick upload

<figure><img src="/files/mrO856ZdIRnyhC7nv5Qi" alt="" width="375"><figcaption></figcaption></figure>

***

### 2. **Upload Your File**

* Drag and drop a file into the upload area,\
  or click **Browse Files** to select one from your device.
* Only **one file** can be uploaded per operation.

📌 Supported formats: `.csv`

***

### 3. **Configure Table Details (Table Tab)**

* **Label**:\
  Provide a friendly name to identify the task.
* **Table Name**:\
  Define the name for the new table that will be created in the project.
* **Project**:\
  Confirm or change the target project for the table.
* **Table Discovery** (enabled by default):\
  When enabled, this makes the table available in:
  * **Power Search** (semantic, natural language search)
  * **AI Dashboard** (automatically generated dashboards)

***

### 4. **Adjust Column Settings (Columns Tab)**

After uploading your file, switch to the **Columns** tab to review and configure each column:

* **Data Type**:\
  Adjust the data type for each column (`String`, `Decimal`, `Date`, etc.) to match the contents.
* **Column Name**:\
  Rename columns as needed for clarity and consistency.
* **Date Format (optional)**:\
  For `Date`-type columns, specify the original format from the CSV (e.g., `dd/mm/yyyy`, `yyyy-mm-dd`).
* **Decimal Size**:\
  Set the number of decimal places for numeric fields.
* **Treat Data Warning**:\
  A notification reminds you to review numeric, decimal, and date fields to ensure they are interpreted correctly.

{% hint style="info" %}
Tip: Use the **"Change all to string"** button to quickly convert all fields to text if unsure.
{% endhint %}

***

### 5. **Finalize the Upload**

* After validating all columns and settings, click **Upload** in the bottom-right corner.

Your new table will be created in the selected project and immediately available for use in queries, dashboards, flows, and AI modules.

***

#### Best Practices

* Ensure column names are clear and well-structured.
* Always double-check data types before uploading — especially for dates and numbers.
* Use descriptive table names to make it easier to locate the data later.

***

{% hint style="warning" %}
If you access this task through the studio, you can only upload a new spreadsheet, without advanced settings.
{% endhint %}

<figure><img src="/files/CNjar7nIB46U71R3dQjk" alt=""><figcaption></figcaption></figure>


# Pivot Table

<figure><img src="/files/AlQYQ5pADy61jWbTT85u" alt=""><figcaption></figcaption></figure>

The **Pivot Table** task in **Gaio DataOS** allows you to reshape your dataset from a long format (rows) into a wide format (columns), turning categorical values into new columns. It’s ideal for creating cross-tab reports, category comparisons, and dashboard-ready summaries.

{% hint style="warning" %}
**Important:** This task can only be used when a **table is selected** in your flow.
{% endhint %}

***

## How to Use

### **1. Open the Pivot Table Task**

* In the left-side menu, go to:\
  **Tasks > ETL > Pivot Table**

***

### **2. Set Task Name and Output Table**

* **Task label**: (optional) A name for this task within your flow.
* **Result table**: The name of the new table to be created from the pivot transformation.

***

### **3. Select Column to Pivot**

* **Column to pivot**: Choose the column whose unique values will become new column headers (e.g., `product_category`).
* **Sort values**: Choose the sorting order for the new columns: `Ascending` or `Descending`.

***

### **4. Configure Pivot Values**

* A list of unique values from the pivot column will appear.
* You can rename each one under the **Transpose** column to customize the new headers.

***

### **5. Select Value to Aggregate**

* **Value to pivot**: Choose the numeric column you want to summarize (e.g., `sales_amount`, `units_sold`).
* **Aggregation values**: Select the aggregation method:
  * `Sum`
  * `Average`
  * `Count`, etc.

***

### **6. Optional: Add Extra Columns**

* **Extra columns**: Select columns that should be preserved in the output (e.g., `region`, `date`).
* **Position of extra columns**: Choose whether they appear `At start` or `At end` of the resulting table.

***

### **7. Save and Run**

* **Save**: Saves the task for later use in the flow.
* Click **Run** to execute the task in your flow.

***

&#x20;Use Cases

* Compare product categories side by side
* Summarize metrics by region, time, or status
* Create custom pivot views for dashboards
* Transform transactional data into report-ready formats


# Unpivot Table

<figure><img src="/files/nFK6VFPF8db2nnVeU9kV" alt=""><figcaption></figcaption></figure>

The **Unpivot Table** task in **Gaio DataOS** allows you to transform a wide-format table (with multiple columns representing categories or dates) into a long-format table (where values are stacked into rows). This is especially useful for time series, monthly reports, and dashboards requiring dynamic filtering.

{% hint style="warning" %}
**Important:** This task can only be used when a **table is selected** in the flow.
{% endhint %}

***

## How to Use

### **1. Open the Unpivot Table Task**

* Go to the menu:\
  **Tasks > ETL > Unpivot Table**

***

### **2. Set Task Information**

* **Task label**: (optional) Name for identifying this step in your flow.
* **Result table**: Enter the name of the new table that will contain the unpivoted data (e.g., `unpivot_table`).

***

### **3. Select Unpivot Columns**

* **Unpivot columns**: Select the columns whose values will be transformed into rows (e.g., `January`, `February`).
* These columns will become the values in a new "category" field, and their corresponding values will move into a single “quantity” column.

***

### **4. Sort Values (Optional)**

* **Sort values**: Choose `Ascending` or `Descending` if you want to control the order of unpivoted rows by column category.

***

### **5. Add Extra Columns (Optional)**

* **Extra columns**: Select columns that should remain unchanged and be repeated in the resulting unpivoted table (e.g., `Region`, `Product`).
* **Position of extra columns**: Choose whether they appear `At start` or `At end` of the result.

***

### **6. Save and Run**

* Click **Save** to store the task in your flow.
* Click **Run** to execute the task in your flow.&#x20;

***

#### Best Practices

* Use **clear numeric fields** (e.g., `valor`, `quantidade`) as the "Value to pivot" to avoid confusion in the resulting `quantity` column.
* Ensure your **column names are correct** — in the screenshot, `Novemvro` should be corrected to `Novembro`.
* Always preview the output and validate if your new table preserves the desired relationships.

***

#### Use Cases

* Convert monthly sales columns into a time series
* Normalize survey responses or data from spreadsheets
* Simplify data structure for dashboards and filtering
* Prepare wide-format datasets for analytical models

***

#### Example Output

<figure><img src="/files/swZJXxhbE5wlZsfS56Ld" alt="" width="563"><figcaption></figcaption></figure>

Given the configuration shown in the screenshot, the output table will include:

| Tipo       | category | quantity    |
| ---------- | -------- | ----------- |
| Pay        | December | 313088.1023 |
| Pay        | January  | 0           |
| Pay        | February | 0           |
| ...        | ...      | ...         |
| to receive | October  | 268242.7913 |
| to receive | November | 293688.738  |

Where:

* `Tipo` is preserved as an **extra column**
* `category` was generated from the selected **month columns**
* `quantity` holds the original values


# Run Process

<figure><img src="/files/Ajrj1oq3heNQJL5OnU3B" alt=""><figcaption></figcaption></figure>

In the middle of a Gaio process, it is possible to call another process. Simply choose **Execute Process from the Tasks menu** and define which process will be executed.

Two applications of this feature are:

1. **Automation of various processes** . A new process can be created where several other processes are called, sequenced and this "macro" process is automated in Scheduling .
2. **Looping Creation** : Having a process A and another B, the following procedure can be adopted. Process A has a call from process B with the **Execute Process task** . In process B, there is no task other than the **Execute Process** , and process A is called in it. When process A is executed, it will enter an infinite loop. So that the looping is not infinite, the analyst can set any task in the process to a stop criterion, by right-clicking and choosing **Edit properties** .

<figure><img src="/files/KqDkm2HCDsnHzB33KO9k" alt="" width="326"><figcaption></figcaption></figure>

**Conditional Rules** options , you can choose **Stop execution from this point** . As a criterion for stopping the execution of the entire process, any application **parameter can be used.** This parameter can receive values at each execution of the process, through the [Table for Parameters task](/tools/tasks/etl/table-to-parameters) . This way the parameter values are updated and will determine whether the process should stop executing or not.

<figure><img src="/files/SMW3AmOZYNX0vIgGXpeL" alt=""><figcaption></figcaption></figure>


# REST

<figure><img src="/files/vbInGz4RoQOr03Blj1ax" alt=""><figcaption></figcaption></figure>

The **REST Task** in Gaio DataOS allows you to connect to any external API — public or private — directly within your data flow. You can use it to **fetch data, post information, automate API integrations**, convert JSON responses into usable tables inside your project, and integrate AI, analytics, and workflows with external services.

***

## Supported HTTP Methods

The REST Task supports the following HTTP methods:

| Method |                             |
| ------ | --------------------------- |
| GET    | Retrieve data               |
| POST   | Send data/ create resources |
| PUT    | Replace resources           |
| PATCH  | Partially update resources  |
| DELETE | Remove resources            |

{% hint style="info" %}
The behavior of **PUT, PATCH, and DELETE** follows the same semantics commonly used in REST
{% endhint %}

***

## &#x20;How to Use the REST Task

***

### 1. **Open the REST Task**

* In the **Studio**, go to the **Tasks** panel.
* Under the **ETL** section, select **REST**.

***

### 2. **Choose Method and Configure URL**

* Select the HTTP method: `GET`, `POST`, `PUT`, `DELETE`, etc.
* In the URL field, type the API endpoint.
* You can use **dynamic parameters** in the URL:

  ```plaintext
  {{params.param_name}}
  {{table.table_name.column_name}}
  ```

  **Example**:

  ```
  https://api.example.com/users/{{user_id}}/posts?status={{status}}
  ```

{% hint style="info" %}
URL parameters are **resolved automatically at runtime**.
{% endhint %}

***

### 3. **Add Parameters**

In the **Parameters** tab, you can define URL parameters:

* **URL Parameter:** Name of the parameter (e.g., `userId`).
* **Value:** Static or dynamic value (e.g., `{{param.user_id}}`)

Click **+ Add Parameter** to add more.

***

### 4. **Define the Request Body (if needed)**

In the **Body** tab, you can:

* Enter JSON content for the request body (mainly used for `POST` and `PUT`).
* Use dynamic variables inside the content.

{% hint style="info" %}
For **POST**, **PUT**, and **PATCH** requests, you can define a **request body**.
{% endhint %}

Example body using table data:

```json
{
  "id": "{{ table.sales_rest.sale_id }}",
  "product": "{{ table.sales_rest.product }}"
}

```

### Send all table data in a single batch

<figure><img src="/files/cEkfeaTxL3pRz4Z9Vzgm" alt=""><figcaption></figcaption></figure>

* **Enabled** → Sends the entire table as one request
* **Disabled** → Sends one request per row

This is useful for:

* Bulk inserts
* Batch updates
* High-performance integrations

***

### 5. **Headers and Authorization**

* **Headers tab**: add custom headers like Authorization, Content-Type, Accept, Bearer Tokens
* **Authorization tab**: configure Basic Auth.

***

### 6. **Result Tab**

This tab controls how the **API response is interpreted and converted into a table**.

* **Structure Identification:** Lets Gaio automatically detect column names and data types. Set to “Automatic” by default.
* **Object Property:** Define the path to the array in the JSON response, if it’s nested. Example: results.items.&#x20;
* **Always Drop Table:** If enabled, the existing result table will be **replaced** each time the task runs.
* **Input Columns to Keep:** Select which columns from the response should be stored.
* **Object Property That Holds Results:** Define the JSON property that contains the result list.

Behavior:

* If the API returns a **JSON object**, one row will be created.
* If it returns a **JSON array**, each item will be inserted as a separate row.

***

#### 7. **Error Log Tab**

This tab allows you to **capture and store any errors** encountered during execution.

* **Log Table:** The name of the table that will receive error logs from the REST task (e.g., `log_api_errors`)

This makes debugging and monitoring easier in production.

<figure><img src="/files/qarq0xxEXS4o2ZCkxWAm" alt=""><figcaption></figcaption></figure>

***

## REST Task · Bulk Mode

The **REST Bulk mode** extends the standard REST Task by enabling **batch-oriented API requests**.\
Instead of sending one request per row, the task can **aggregate table data and send it in batches** to an external API. This mode is ideal for **high-volume integrations**, **bulk inserts**, and **performance-optimized API workflows**.

<figure><img src="/files/ZIMLUtPKgOpVFK1iMsTS" alt=""><figcaption></figcaption></figure>

### When to Use REST Bulk

Use REST Bulk when:

* The API supports bulk payloads.
* You want to reduce the number of HTTP requests.
* You need to send large datasets efficiently.
* You are synchronizing tables with external systems.

{% hint style="info" %}
REST Bulk is especially useful for **POST**, **PUT**, and **PATCH** operations.
{% endhint %}

## Bulk Configuration Overview

Bulk-specific settings are configured in the **Body** tab and include:

* Batch execution control
* Pagination over table data
* Optional schema definition for batch payloads

#### Enable Bulk Mode

* Enable “Send all table data in a single batch”.
* When enabled:
  * The REST Task sends **multiple rows together**
  * Payload is constructed from the source table
  * Execution is optimized for throughput

#### Batch Size (Table Pagination)

* Define how many rows are sent per request.
* **Numeric value:** Number of rows per batch.
* **0:** Load and send the full table in a single request.

#### Body Payload (Bulk)

The **Body editor** defines how batch data is sent.

Example:

```json
{
  "data": {{ table.sales_rest }}
}

```

In this example:

* `table.sales_rest` resolves to an array of rows
* Each batch injects a subset of the table
* The API receives a structured list of records

This pattern is common for APIs expecting payloads like:

```json
{
  "data": [
    { ... },
    { ... }
  ]
}

```

### Runtime Behavior (Bulk Mode)

At execution time:

1. The task reads the source table
2. Splits data according to batch size
3. Injects each batch into the request body
4. Sends one request per batch
5. Processes API responses
6. Writes results to the configured result table

#### Relationship with HTTP Methods

* **POST** → Bulk create
* **PUT** → Bulk replace
* **PATCH** → Bulk update
* **DELETE** → Bulk delete (API-dependent)

{% hint style="info" %}
Bulk mode affects **how data is sent**, not **how results are parsed**.
{% endhint %}

### Bulk at Root

The **REST Bulk at Root** mode is a variation of the REST Bulk configuration where **table data is sent directly at the root of the request body**, instead of being wrapped inside an enclosing object (such as `{ data: [...] }`).

This mode is designed for APIs that **expect a raw array or object at the root level** of the request payload.

#### When to Use Bulk at Root

Use **Bulk at Root** when:

* The API expects a **JSON array at the root.**
* No wrapper property (e.g. `data`, `items`, `payload`) is allowed.
* You are integrating with strict REST or ingestion APIs.
* The API specification explicitly defines the body as a root collection.

**Example API expectation:**

```json
[
  { "id": 1, "product": "A" },
  { "id": 2, "product": "B" }
]

```

#### Key Difference from Standard REST Bulk

| Mode                  | Payload Structure     |
| --------------------- | --------------------- |
| **REST Bulk**         | `{ "data": [ ... ] }` |
| **REST Bulk at Root** | `[ ... ]`             |

#### Body Payload (Root)

In **Bulk at Root**, the body contains **only the table reference**, without any wrapper.

**Example Body:**

```json
{{ table.sales_rest }}
```

## Bulk With Schema

<figure><img src="/files/6PHWlpeOvw4CSlccTxb7" alt=""><figcaption></figcaption></figure>

The **REST Bulk With Schema** mode extends REST Bulk by allowing you to **explicitly define the structure of each record** before sending data to an external API.

Instead of sending raw table rows, you define a **custom schema template** that controls:

* Which fields are sent
* How fields are named
* How table columns are mapped into the payload

This mode is ideal when APIs require **strict payload contracts** or **custom field mappings**.

### When to Use Bulk With Schema

Use **Bulk With Schema** when:

* The API requires a **specific JSON structure.**
* Table column names do not match API field names.
* You need to omit or rename fields.
* You want full control over the outgoing payload.
* You are integrating with strict or enterprise APIs.

### How Bulk With Schema Works

Bulk With Schema introduces a **two-layer payload definition**:

1. **Schema definition** → how a single record should look
2. **Body template** → how records are grouped and sent

The system generates the batch dynamically by applying the schema to each row.

#### Bulk Execution Settings

* Enable batch-based execution.
* Define how many rows are sent per request.
* Enable “Define the table data schema”.

**Example schema:**

```json
{
  "id": "{{ table.sales_rest.sale_id }}",
  "product": "{{ table.sales_rest.product }}"
}

```

This means:

* Each row in `sales_rest` is transformed into this structure.
* Field names are controlled explicitly.
* Only mapped fields are sent.

{% hint style="info" %}
The schema is applied **per row**, even when sending data in bulk.
{% endhint %}

| Mode                      | Typical Structure          |
| ------------------------- | -------------------------- |
| **REST Bulk**             | `{ "data": {{ table }} }`  |
| **REST Bulk at Root**     | `{{ table }}`              |
| **REST Bulk With Schema** | `{ "data": {{ schema }} }` |

#### Best Practices

* Always **Run test** before finalizing the configuration.
* Use **POST/PUT/PATCH** for mutations.
* Use **dynamic parameters** to reuse the same task with different inputs.
* Use batch mode for high-volume APIs.
* When using nested JSON, define the **Object Property** path precisely.
* Enable the **Error Log** tab to trace failed API calls and improve reliability.
* Validate API responses before downstream use.


# Parameters to Table

<figure><img src="/files/DXRdkbfNjxBwvqOX9kYe" alt=""><figcaption></figcaption></figure>

The **Param to Table** task in **Gaio DataOS** allows you to generate a table containing the values of selected [parameters ](broken://spaces/-MPpFa6rq60XeC7QMDh7/pages/-MRfxF3BmSVB6yYzqn4b)available in the current environment. This is useful when you want to use parameter values inside flows, merge them with data sources, or display them dynamically in reports.

{% hint style="warning" %}
This task can only be used when one or more parameters are already defined in the environment (either global, user, or contextual parameters).&#x20;
{% endhint %}

***

## How to Use

### **1. Open the Task**

Go to the menu:\
**Tasks > ETL > Param to table**

***

### **2. Configure the Task**

* **Task label**: (optional) Name for identifying this step in your flow.
* **Result table**: Enter the name of the new table that will store the selected parameters (e.g., `param_table`).

***

### **3. Select Parameters**

* Under the **params** section, all available parameters will be listed.
* Use the checkbox to select the ones you want to include in the resulting table.
* You can filter the list if many parameters are available.

**Example:**\
Select `userId`, `region`, and `product` to create a table with those values as columns.

***

### **4. Save and Use**

* Click **Save** to register the task in your flow.
* The resulting table will contain a **single row**, with each selected parameter as a **column** and the current value of that parameter as the cell content.

***

#### ✅ Use Cases

* Join parameter values with external or internal tables
* Use parameter values as inputs to other ETL steps
* Display user-specific or dynamic filters in dashboards
* Log or export execution context for audits or tracking

***


# Table to Parameters

<figure><img src="/files/cVtcWnjEq4wzblXyUKV7" alt=""><figcaption></figcaption></figure>

The **Table to Param** task in **Gaio DataOS** allows you to convert values from one or more table columns into reusable **parameters** within your flow.\
This feature is ideal for dynamically extracting data and using it as input in other tasks, filters, or dashboards.

{% hint style="warning" %}
This task can only be used when a **table is selected** in the flow.️&#x20;
{% endhint %}

***

## &#x20;How to Use

### **1. Open the Task**

In the left-side menu, go to:\
**Tasks > ETL > Table to Param**

***

### **2. Set Basic Information**

* **Task label**: (optional) Name for identifying this step in your flow.
* **Table**: Automatically populated with the selected table (e.g., `new_sales`).

***

### **3. Advanced Options**

&#x20;**Save values as default**

When enabled, this will store the extracted parameter values as default values, available outside the current flow if needed.

**Custom reference from column to param**

When enabled, allows you to **manually map each column** of the table to a **specific parameter**.

***

### **4. Map Columns to Parameters**

* For each column listed, choose a parameter to assign its value to.
* You can select from existing parameters.
* Only **one row** is read — usually the **first row** of the selected table.

**Example Mapping:**

| Table Column | Mapped Parameter |
| ------------ | ---------------- |
| `order_id`   | `@order_id`      |
| `region`     | `@user_region`   |
| `total_sale` | `@total_sales`   |

***

### **5. Save and Use**

* Click **Save** to include the task in your data flow.
* The captured values will now be available as **environment parameters** and can be used in:
  * SQL queries
  * Filters
  * Dashboards
  * Python or JavaScript blocks

***

#### &#x20;Use Cases

* Capture input values to personalize reporting
* Feed parameters based on outputs of tables
* Drive conditional logic based on dynamic table values
* Create reactive dashboards powered by runtime variables


# Define parameter value

<figure><img src="/files/SwluzXR5eDnRbMJHSDT7" alt=""><figcaption></figcaption></figure>

The **Define Parameter Value** task allows you to manually assign a new value to an existing parameter within your data flow in **Gaio DataOS**.\
It’s a key feature for **controlling flow execution**, **dynamically updating context**, or **overriding default values** at runtime.

***

## How to Use

### **1. Open the Task**

Navigate to:\
**Tasks > ETL > Define Parameter Value**

***

### **2. Configure the Task Fields**

* **Label:** (Optional) A custom label to identify this task in your flow.
* **Param:** Select the parameter you want to update. It must already exist in the environment.
* **Default:** The parameter’s original default value (read-only).
* **Current:** The current value in use before the update (read-only).
* **Value:** The new value that will be assigned to the parameter during flow execution.

{% hint style="warning" %}
The value defined here will temporarily **override** the current parameter value during the flow run, and can be reused by other tasks in the sequence.
{% endhint %}

***

### **3. Save and Apply**

* After entering the new value in the **Value** field, click **Save**.
* When the flow is executed, the parameter will be updated in real time with the new assigned value.

***

#### Use Cases

* Dynamically update filters or variables before executing queries
* Apply conditional logic based on runtime-defined values
* Customize executions using user input or contextual values
* Override previously inherited parameters from other flows or default settings


# Users

<figure><img src="/files/qYW0kNEpZp7YqMK3caiV" alt=""><figcaption></figcaption></figure>

The **User** task in **Gaio DataOS** allows you to generate a table containing information about **all registered users** on the platform.\
This feature is particularly useful for access control, user management, governance reporting, and auditing flows based on user roles and permissions.

***

## How to Use

### **1. Open the Task**

Navigate to:\
**Tasks > ETL > User**

***

### **2. Define the Result Table Name**

* **Result table**: Enter the name of the table that will store the user data (e.g., `users_table`, `platform_users`, etc.).

***

### **3. Select the Desired Columns**

You can choose which user attributes to include in the output table:

| Column         | Description                                     |
| -------------- | ----------------------------------------------- |
| **Name**       | Full name of the user                           |
| **Email**      | Associated email address                        |
| **Created at** | Date the user account was created               |
| **Group**      | Group or permission set the user belongs to     |
| **Role**       | User access level (e.g., Admin, Editor, Viewer) |

> &#x20;Select only the fields you need for your process or report.

***

### **4. Save and Use**

* Click **Save** to add the task to your flow.
* Upon execution, the system will generate a table with **one row per user**, using the selected columns.

This table can be used for joins, permission validation, governance dashboards, or user-based filtering in flows and reports.

***

#### Use Cases

* Build governance dashboards to list all platform users
* Track user access levels, roles, and group associations
* Audit who has access to which environments or data
* Cross-reference users with logs or activity history


# CSV Web

<figure><img src="/files/wjPYIdFTySf9m6LXuC3S" alt=""><figcaption></figcaption></figure>

The **CSV Web** task in **Gaio DataOS** allows you to automatically import a CSV file hosted on a public URL directly into your project environment.\
This feature is ideal for integrating external data, such as publicly shared spreadsheets, third-party system exports, or APIs that provide CSV downloads.

***

## &#x20;How to Use

### **1. Open the Task**

Navigate to:\
**Tasks > ETL > CSV Web**

***

### **2. Configure the Task**

* **Task label**: (optional) Name for identifying this step in your flow.
* **Result table**: Name of the table that will be created or populated with the imported data.
* **File URL:** Public URL of the CSV file (e.g., `https://example.com/data.csv`)
* **Params applicable:** If the URL includes dynamic elements, you can use environment parameters (example:`https://pncp.gov.br/api/pncp/v1/orgaos/{{params}}/csv`)
* **Fields terminated by:** Define the delimiter used in the CSV file (`Comma`, `Semicolon`, `Tab`, etc.)

***

### **3. Advanced Options**

* **Auto detect schema (column names)**\
  When enabled, the system will detect and assign column names and types based on the first row of the CSV.
* **Insert mode: append records to table**\
  When enabled, new data will be **appended** to the existing records in the table.\
  When disabled, the table will be **overwritten** with the new data.

***

### **4. Save and Use**

* Click **Save** to add the task to your flow.
* When executed, Gaio will fetch the CSV from the URL and import the data based on your configuration.

***

&#x20;Use Cases

* Connect to public datasets from government, finance, or climate sources
* Integrate regularly updated reports hosted via HTTP
* Import data maintained in external systems that expose CSVs
* Automate ingestion of live or scheduled data feeds


# CSV Local

<figure><img src="/files/ozxg9jiWK2r8sTVRd9By" alt=""><figcaption></figcaption></figure>

The **CSV Local** task in **Gaio DataOS** allows you to automatically import CSV files that have been uploaded to a **local directory within the platform environment**.\
This is ideal for handling input files delivered manually or through integrations with external systems that deposit files into internal folders for processing.

***

## &#x20;How to Use

### **1. Open the Task**

Navigate to: **Tasks > ETL > CSV Local**

***

### **2. Fill in the Task Fields**

* **Task label:** (Optional) Name to identify the task in your flow.
* **Result table:** Name of the table to be created or updated with the CSV content.
* **Separator:** Delimiter used in the CSV (`comma`, `semicolon`, `tab`, etc.)
* **Folder:** Folder path where the CSV file was uploaded (e.g., `~/content/apps/31/imports/`)

{% hint style="warning" %}
You must **enter only the folder path**, not the file name.
{% endhint %}

***

### **3. Advanced Options**

* **Auto detect schema (column names)**\
  Automatically detects column names and data types from the first row of the file.
* **Insert mode: append records to table**\
  If enabled, new CSV records will be **appended** to the existing table.\
  If disabled, the table will be **overwritten**.
* **Delete after import**\
  Deletes the file from the folder after successful import.\
  Recommended to prevent reprocessing or cluttering the folder.

***

### **4. Save and Execute**

* Click **Save** to add the task to your flow.
* When the flow runs, the system will automatically retrieve the most recent CSV file from the specified folder and import its content based on your settings.

***

#### Use Cases

* Process files uploaded manually or via FTP/SFTP
* Integrate systems that export CSV files to internal directories
* Automate batch data ingestion (e.g., sales, inventory, customer records)
* Manage file lifecycle with automatic deletion after import


# Google Spreadsheet

<figure><img src="/files/aiuDwWdHfeiz1Yrco7X4" alt=""><figcaption></figcaption></figure>

The **Google Spreadsheet** task in **Gaio DataOS** allows you to import data directly from a **public Google Sheets document** into your data flow.\
This is ideal for real-time collaboration when data is managed externally by other teams, clients, or shared systems.

***

## How to Use

### **1. Open the Task**

Navigate to:\
**Tasks > ETL > Google Spreadsheet**

***

### **2. Fill in the Task Details**

* **Task label**: (Optional) A name to identify this task in the flow (e.g., `Import Client Sheet`).
* **Result table**: Name of the table that will be created or updated with the imported data.
* **Full URL or DOC output ID:** Provide the full public link to the spreadsheet or just the document ID (e.g., `1aB2C3D4E5FgHiJ`)

{% hint style="danger" %}
**Important Requirements:**

* The spreadsheet must be **publicly web** (Anyone with the link can view) and comma separed value.&#x20;
* The **first row** must contain the **column headers**
* Avoid **whitespace** or **special characters** in column names for best compatibility
  {% endhint %}

***

### **3. Configure Insert Mode (Optional)**

* **Insert mode: append records to table**\
  If enabled, new data will be **appended** to the existing table.\
  If disabled, the table will be **overwritten** with the spreadsheet’s current contents.

***

### **4. Save and Execute**

* Click **Save** to add the task to your flow.
* When executed, the spreadsheet data will be fetched and loaded into the specified table.

***

#### &#x20;Use Cases

* Import lists or forms shared by external teams or clients
* Connect spreadsheets maintained by business units (e.g., marketing, sales, finance)
* Automate reports based on manually updated Google Sheets
* Integrate legacy system data shared via Google Sheets


# Analytics


# Sample

<figure><img src="/files/JqREMiCr23EB9kM1t0w3" alt=""><figcaption></figcaption></figure>

The **Sample** task in Gaio DataOS allows you to extract a subset of data from a table in a simple and controlled way. This functionality is ideal for **testing, validation, initial visualizations, or preprocessing in Machine Learning workflows**.

{% hint style="warning" %}
This task can only be used when a **table is selected** in the flow.️&#x20;
{% endhint %}

***

## How to Use the Sample Task

***

### 1. **Add the Sample Task to Your Flow**

* In the **Studio**, go to the **Tasks** panel.
* Under the **Analytics** section, select **Sample** task.

***

### 2. **Configure the Main Fields**

* **Task label**: (optional) Provide a name for this task within your flow.(default: `sample`)
* **Result table**: name of the output table that will contain the sampled data (e.g., `sample_sample`)

***

### 3. **Choose the Sampling Type**

You can choose between two options:

&#x20;**Percentage**

* Allows you to define the percentage of rows to be sampled from the original table.
* You can adjust the **slider** or manually input the value.
* **Example**: `0.7` (70%) → returns 70% of the rows from the source table.

**Rows**

* Allows you to define a **fixed number of rows** to extract as a sample.
* **Example**: `1,000` → the output table will contain exactly 1,000 randomly selected rows.

***

### 4. **Save and Execute**

* Once you’ve configured the sample type and value, click **Save**.
* Run the flow — a new table will be generated based on the selected sample configuration.

***

#### Best Practices

* Use the **Sample** task to:
  * Reduce dataset size during development or dashboard previews.
  * Create smaller datasets for training ML models.
  * Test queries and transformations without processing the full dataset.
* Combine with other tasks like **AutoML**, **Cluster**, or **Scoring** to streamline your experimentation and modeling.

{% hint style="success" %}
All columns from the source table will be present in the random table. Only the number of lines will be smaller.
{% endhint %}

***


# AutoML

<figure><img src="/files/PVpdvC1vhGEvE7bOt2gk" alt=""><figcaption></figcaption></figure>

Gaio uses technology to create predictive models H2O AutoML (Automatic Machine Learning). This means that Gaio operationalizes the connection to data, data processing, delivers training and modeling data and directives to H2O AutoML, retrieves the result of the execution and delivers the results in a user-friendly interface. This entire process can be automated within Gaio.

***

## How to Use the AutoML

***

### 1. Access the "AutoML" Task

In the left-side menu, go to **Analytics** and select the **AutoML** task.

***

### 2. Configure the Model

In the configuration screen:

* **Model Name**(optional): Enter a name for your model (e.g., `auto_ML`).
* **Table**: Select the data source table.
* **Target**: Choose the variable you want to predict (e.g., `status`).
* **Columns to remove**: If there are columns that should be excluded (such as IDs), list them here.
* **Training Time (Seconds)**: Estimated time the system will use to train the models.
* **Rows limit**: By default, Gaio uses up to 100,000 rows to train the model. You can adjust this, but higher values may overload the server.

{% hint style="info" %}
The modeling process is often memory and processing intensive. Therefore, special attention to the volume of rows in the table to be used is essential. A good one **sample** it is an excellent strategy as it generally represents the entire data set well and thus allows more models to be created in less time, in addition to not overloading the server. For large datasets, use the **Sample** task first to reduce volume and optimize performance.

By default, Gaio limits it to **100 thousand lines**, however it is possible to change this value, but it is necessary to be aware of the impact and it is only interesting in cases where the server is very large.
{% endhint %}

Click **Save and Train** to begin the process.

***

### 3. Track the Progress

While training, the interface displays two progress bars:

* **Preparation**: Data preprocessing stage.
* **Training**: Model construction and testing.

***

### 4. Techniques

Several techniques are used in the automatic modeling process. The following list contains the link to the official H2O documentation:

* [GLM: ](https://docs.h2o.ai/h2o/latest-stable/h2o-docs/data-science/glm.html)Generalized Linear Model.
* [XGBoost:](https://docs.h2o.ai/h2o/latest-stable/h2o-docs/data-science/xgboost.html) Combination of multiple decision trees created in parallel.
* [GBM:](https://docs.h2o.ai/h2o/latest-stable/h2o-docs/data-science/gbm.html) Gradient Boosting Machine.
* [DeepLearning:](https://docs.h2o.ai/h2o/latest-stable/h2o-docs/data-science/deep-learning.html) use of Neural Networks.

Training and validation criteria are applied. Gaio uses Cross-Validation to evaluate whether the models are being assertive. A 5-Fold is used to generate 5 random samples of the same size that will be used to train several models, as shown in the image below:

<div align="center"><img src="/files/Yh6faJihYFGejHgsfieT" alt=""></div>

The criterion for prioritizing the model is **Accuracy** .

Categorical (text) and Numeric are accepted as response variables. In the case of a numerical variable, it will always be considered that the desire is to predict the number and not to indicate the probability of that event occurring.

{% hint style="info" %}
If the response variable is, for example, **Service Cancellation** and has values 0 or 1, it will be necessary to transform the values in this column into, for example, R0 or R1. This is because in this case we expect to know the probability of the customer canceling, that is, being 1 and at the same time the probability of the customer being 0, not canceling. However, as it is a numerical variable, Gaio understands that the intention is to predict a number, such as the **amount that the customer can purchase** . Different techniques and different results are applied to the two different types of response variable.
{% endhint %}

### 5. Review the Results

<figure><img src="/files/WKshzH2OiRrPhqybKFXY" alt=""><figcaption></figcaption></figure>

Once completed, the system will display a full report including:

* **Summary:** A summary of the automatic model building process is generated, and the overall quality of the model is reported.
  * **Model Accuracy**: Shows the accuracy of the best model created.
  * **ROC Curve**: A visual representation of model performance.
  * **Most Important Variables**: Lists the top predictive features in order of importance.
* **Models:** The list of all models that were created in the predetermined time with some model quality statistics.
* **Supporting Tables**:
  * **Cross Validation**
  * **Confusion Matrix**
  * **Gain Table**
  * **Maximum Metrics**

***

### 6. Apply the Model

The trained model is saved and can be reused through the **Scoring** task to apply predictions to new data.


# Scoring

<figure><img src="/files/8n1gG48pQB9yIBZQSDJB" alt=""><figcaption></figcaption></figure>

This task is task dependent AutoML. To use it, you must have previously created at least one model using AutoML.

Its usefulness is to apply the model to a new set of data. As an example, a company needs to charge its customers. To do this, she built a predictive model (AutoML) using her billing history, as she knows who paid and who didn't pay.

Now the company received a portfolio of customers at the beginning of the month to charge and wants to **apply** the model it had created to know who will pay and who will not pay. In addition to having this marking, she also wants to know the probability (0 to 1 or 0% to 100%) for each customer.

***

## How to Use the Scoring

***

### Access the "Scoring" Task

In the left-side menu under the **Analytics** section, click on **Scoring**.

***

### Set Up the Parameters

Fill in the following fields:

* **Task label**: (optional) Give a name to your scoring task (e.g., `scoring`).
* **Result table**: Define the name of the output table where the scored results will be saved.
* **Source table**: The table should be automatically linked from your selected block.

{% hint style="info" %}
The table that contains the customer portfolio for billing must have exactly the same columns as those in the table used to create the model with AutoML. The only column it will not have is the response variable, which in practice is what we want to know now (which customer will pay or not). Therefore, in [AutoML ](https://app.gitbook.com/o/0AwHT1YPyV5KV6qHeJNz/s/-MPpFa6rq60XeC7QMDh7/documentacao-1/studio/tarefas/analytics/automl), it is important to only use variables that we will have later to apply **Scoring** . If the columns do not match, an **error will be returned** .
{% endhint %}

***

### Select the Trained Model

Below the configuration section, a list of available models will appear. Select the model you want to use (e.g., `auto_ML`).

***

### Save and Execute

Click the **Save** button in the top right corner to apply the model and generate the results in the defined table.

***

### Output

The resulting table will include:

* The original data from the source table.
* New columns containing the predicted scores or classifications.
* Additional probability or confidence metrics (depending on the model type).

#### Example

Below is an example for the case where the response variable is categorical and has two values ( **no** and **yes** ).

<figure><img src="/files/Ay6TRfTFln7HH1AVPc0R" alt=""><figcaption></figcaption></figure>

1. Forecast with two possible values for each customer.
2. Probability of **no.**
3. Probability of **yes.**
4. From that column cod\_cliente, all columns from the source table are repeated and are available for any analysis in the Gaio process.


# Cluster

<figure><img src="/files/zJNAMj4RhSynvyH1cgse" alt=""><figcaption></figcaption></figure>

The **Cluster** task in Gaio DataOS applies clustering algorithms to **group records with similar characteristics**. It's ideal for use cases such as customer segmentation, pattern recognition, and data-driven decision-making based on behavioral or structural profiles.

Gaio uses the **K-Means** technique to identify groups and analysis calculations are made in H2O, whose documentation can be [accessed here](https://docs.h2o.ai/h2o/latest-stable/h2o-docs/data-science/k-means.html).

***

## How to Use the Cluster Task

***

### 1. **Open the Cluster Task**

* In the **Studio**, go to the **Tasks** panel.
* Under the **Analytics** section, select **Cluster**.

***

### 2. **Configure the Task**

* **Task label**: (optional) Name for identifying this step in your flow.
* **Result table:** Output table that will contain the clustered results. Example: `cluster_campaign.`
* **Table name**: Automatically populated with the selected table (e.g., `new_sales`).

***

### 3. **Exclude Columns (Optional)**

* In the **Exclude columns** field, add columns that should **not be considered** in the clustering process, such as unique IDs (e.g., `cod_cliente`).
* This helps avoid bias or noise in the algorithm.

***

### 4. **Adjust Execution Settings**

&#x20;**Execution time**

* Defines the **maximum runtime** of the clustering algorithm (in seconds).
* Recommended: between **20 and 60 seconds**, depending on dataset size and complexity.

&#x20;**Max cluster size**

* Sets the **maximum number of clusters** the algorithm can create.
* Example: if set to `3`, the output will contain up to 3 distinct groups.

**️ Automatic clusters size**

* When enabled, Gaio will **automatically determine the ideal number of clusters** based on the data's variability.
* When disabled, it will strictly follow the manual limit set in **Max cluster size**.

***

### 5. **Save and Run**

* Click **Save** to confirm the task configuration.
* Run the flow — the output table will contain your clustered data.

***

#### &#x20;Output

The resulting table will include:

* All original columns (excluding those set to be ignored)
* A new column indicating the **assigned cluster ID** for each row

***

#### Best Practices

* Use tasks like **Sample** or **Principal Component Analysis (PCA)** beforehand to reduce dimensionality and improve performance.
* Remove irrelevant or high-cardinality columns that could distort clustering results.
* Leverage clustering to personalize campaigns, identify customer profiles, detect anomalies, or support retention strategies.


# Principal Components

<figure><img src="/files/TQ8EsD1lmpCmF5bMZloO" alt=""><figcaption></figcaption></figure>

When you have a large set of columns (mainly numeric), it may be interesting to reduce them to a few columns that will well represent the variability existing in the different columns.

One method for this is Core Components. Gaio uses [H2O ](http://docs.h2o.ai/h2o/latest-stable/h2o-docs/data-science/pca.html)to perform the calculations and summarize the data in a few columns. The algorithm accepts both numeric and categorical variables.

***

## How to Use the PCA Task

***

### 1. **Open the Principal Component Analysis Task**

* In the **Studio**, go to the **Tasks** panel.
* Under the **Analytics** section, select on **Principal Component Analysis**.

***

### 2. **Configure the Main Fields**

* **Task label**: (optional) Name for identifying this step in your flow.
* **Result table:** Output table that will contain the principal components. Example: pca.
* **Source table:** Automatically populated with the selected table (e.g., `new_sales`).
* **Components amount:** define how many principal components you want to extract.

***

### 4. **Select Columns to Remove (Optional)**

* In **Columns to remove**, you can exclude columns that should **not** be considered in the PCA calculation (e.g., IDs, codes, irrelevant fields).
* This helps avoid bias and improves the quality of the results.

***

### 5. **Save and Execute**

* After setting the configuration, click **Save**.
* Run the flow — the output table will contain the extracted principal components.

***

#### Output

The resulting table will include:

* The main components are presented in the first columns and then all the columns of the source table.
* One or more columns representing the **principal components** (e.g., `PCA_1`, `PCA_2`, etc.)
* A simplified dataset ready for further use in tasks like **Clustering**, **AutoML**, or 2D visualizations

***

#### Best Practices

* Use PCA to:
  * Reduce the number of variables in datasets with many numeric features
  * Optimize performance of clustering or classification algorithms
  * Simplify visualizations when working with high-dimensional data
* Combine PCA with tasks that benefit from dimensionality reduction, such as **Cluster** or **Forecast.**


# Association Rules

<figure><img src="/files/aHXlkeEkcYEFLbklQfqB" alt=""><figcaption></figcaption></figure>

Very popular on ecommerce sites, Association Rules or Basket Analysis identify relationships between products. This type of technique makes it possible to offer products that other people have purchased when browsing a specific product page.

Many other applications are possible with this type of technique, such as identifying fraud in tenders (associations between participating companies), identifying affinities between people, among other applications.

Gaio uses [mlxtend](https://rasbt.github.io/mlxtend/) to perform the calculations.

***

## How to Configure the Association Rules Task

***

### 1.  **Open the** Association Rules **Task**

* To identify associations between your data, click on the table that contains at least two columns (Transaction and Item).
* In the **Studio**, go to the **Tasks** panel.
* Under the **Analytics** section, select on **Association Rules.**

***

### 2. **Fill in the Required Fields**

* **Task label**: (optional) Name for identifying this step in your flow.
* **Result table:** Name of the output table that will store the forecast results (e.g., basket\_association\_rules).
* **Source table:** Automatically populated with the selected table (e.g., association\_rules).
* **Minimum Support** : The minimum frequency an itemset must appear to be considered (e.g., `0.2` = 20%). Amount of sales in which the two "products" were together divided by total sales.
* **Minimum Confidence** : The minimum confidence level for a rule to be accepted (e.g., `0.8` = 80%). Given that product A was sold, what is the probability that B will be sold?
* **Column ID** : Column representing the unique ID of the transaction or user (e.g., `order_id`)
* **Category** : Column containing the item, product, or event to be analyzed (e.g., `product_name`).

Having configured this information, the task can be run to search for associations.

***

### 3.  What This Task Does

* Applies **association rule mining algorithms** (like Apriori).
* Generates **"if-then" style rules** that highlight relationships between items.
* Produces a table containing the most relevant combinations, based on support, confidence, and lift.

***

#### Example Use Case

Given a dataset with:

* `order_id` → transaction identifier
* `product_name` → purchased items

***

### &#x20;4. Results

As a result of executing the technique, a table containing the associations is generated. Each line represents an association found based on two defined criteria (minimum support and minimum confidence).

<figure><img src="/files/Kx1AJYeIpeeoZjtPjCY2" alt=""><figcaption></figcaption></figure>

* **antecedents** : In this column appear one or more "products" that, if "purchased", increase the probability of what is in the **consequents** being purchased.
* **consequents:** Here are presented the "products" that are enhanced if the **antecedents** are sold.

The columns with relationship statistics are:

| Indicator        | Formula                                     | Variation        |
| ---------------- | ------------------------------------------- | ---------------- |
| support(A->B)    | support(A+B)                                | 0 to 1           |
| confidence(A->B) | support(A+B) / support(A)                   | 0 to 1           |
| lift(A->B)       | confidence(A->B) / support(B)               | 0 to information |
| leverage(A->B)   | support(A->B) – support(A)\*support(B)      | 0 to 1           |
| conviction       | \[1 – support(B)] / \[1 – confidence(A->B)] | 0 to information |

***

#### Best Practices

* Use datasets that contain multiple items per transaction (e.g., shopping carts, bundles, user actions).
* Apply filters or segmentation before running the task to refine rule generation.
* Visualize results using charts or networks based on rule confidence, support, or lift.


# Forecast

<figure><img src="/files/aqJvbqF4FPEivru4iULB" alt=""><figcaption></figcaption></figure>

Predict sales behavior in the coming months. This is an application of **Time Series**. In essence, the technique relies on a date column and a metric, to analyze three factors:

1. **Seasonality:** peaks at certain cyclical moments (e.g. Christmas).
2. **Trend:** analyzes the speed of growth, decline or stagnation.
3. **Amplitude:** if there are rises and falls over time, it measures whether the distances between peaks and valleys have intensified or not.

Gaio can project the next **months** or **days**. Gaio uses the Facebook algorithm, Prophet, to perform calculations.

Various techniques and parameterizations are applied to the data, generating several projections and their errors are calculated. The model with the lowest error is chosen and the projections are saved in a table in Gaio.

## How to Configure the Forecast Task

***

### 1.  **Open the Forecast Task**

* In the **Studio**, go to the **Tasks** panel.
* Under the **Analytics** section, select on **Forecast**.

***

### 2. **Fill in the Required Fields**

* **Task label**: (optional) Name for identifying this step in your flow.
* **Result table:** Name of the output table that will store the forecast results (e.g., forecast\_times\_series).
* **Source table:** Automatically populated with the selected table (e.g., times\_series).
* **Metrics table:** auxiliary metrics reference table.
* **Date:** Column that represents the date or time.
* **Measure:** Column that contains the values to be predicted (e.g., sales, revenue).
* **Frequency:** Time frequency of the data (`day`, `month`).
* **Periods:** Number of future periods to forecast.
* **Classification (optional):** Enables separate forecasts for each group (e.g., per product, region, customer).

***

### 3. Understanding the Output Table

Once the task runs, the generated table will include the following columns:

| Column     | Description                                                                                                                                                                                           |
| ---------- | ----------------------------------------------------------------------------------------------------------------------------------------------------------------------------------------------------- |
| `category` | The category for group-based forecasts. If classification is not used, this will show `nd` (not defined)                                                                                              |
| `dt`       | Date of the record (historical or forecasted)                                                                                                                                                         |
| `real`     | Historical value from the time series, if available                                                                                                                                                   |
| `type`     | Value type: `real` (observed) or `forecast` (predicted)                                                                                                                                               |
| `forecast` | This column has values for all lines, historical and forecast **.** This is because the model makes projections for the entire past, where it can calculate how far from reality the projections are. |
| `lower`    | Lower bound of the confidence interval                                                                                                                                                                |
| `upper`    | Upper bound of the confidence interval                                                                                                                                                                |

***

### 4. Visualization

It is generally desired to present the series and its projection graphically. In the [Report ](https://app.gitbook.com/o/0AwHT1YPyV5KV6qHeJNz/s/-MPpFa6rq60XeC7QMDh7/documentacao-1/studio/tarefas/delivery/relatorio)task, there is an exclusive graph for **Time Series** .

To create a chart when only one series was projected (without a column in the **Classification** ), go to Reports, drag all the fields except the **category** and sort in ascending order by the **dt column** , the date. Then choose the graphic forecast.

The result should be something similar to the graph below. The blue balls are the actual historical results. The green line is the model, which is applied to the past and future, generating projections.

<figure><img src="/files/2jsKgy6wOBw5LdDrSECV" alt=""><figcaption></figcaption></figure>

***

#### &#x20;Best Practices

* **Ensure clean time series**: The date column must be continuous and consistent (no missing or duplicate dates).
* **Use classifications** to forecast multiple categories independently (e.g., one model per store).
* **Visualize results** in charts (line, area) to easily compare historical data with predictions.


# Python

<figure><img src="/files/411wun5JwpvEk6xKNqtC" alt=""><figcaption></figcaption></figure>

This task allows you to run scripts in Python language, the version used can be chosen according to the versions made available by your Gaio administrator.

This task allows you to run scripts in Python language, the version used can be chosen according to the versions made available by your Gaio administrator. Libraries can be installed and managed by Gaio developers. In addition, we provide a class called bucket that allows you to extract and export data that is in the clickhouse database that your application has permission to use.

{% hint style="info" %}
**Memory Limit**&#x20;

The Python task in Gaio is limited by default to a maximum of 80% of the machine's memory, if it exceeds this limit it will return a memory limit error.
{% endhint %}

***

## How to Configure the Python Task

We will simply navigate through the task interface, and after that we will develop a simple script to serve as an example.

***

### 1.  **Open the Python Task**

* In the **Studio**, go to the **Tasks** panel.
* Under the **Analytics** section, select on **Python**.

***

### 2. **Fill in the Required Fields**

The first page is the main one for the task. In it, on the left, we have the space in a blue theme to write the script, while on the right, in a dark theme, the console is located, where we can view the script's output. To run your script, simply click the "run" button and the result will be displayed in the console.

<figure><img src="/files/WDeGp3HZK2brmmGju4BC" alt=""><figcaption><p>Python Task Code Page</p></figcaption></figure>

It is possible to save the files generated in the script, such as jpeg, png, mp4, pkl files, among others. The name of this folder is **assets.**

{% hint style="info" %}
There are three folders that you can use through the python task, which are the content, inputs and output folders of your application.&#x20;

Below is an example of how to create your path to the outputs folder so you can download the generated image.

```python
path = app_assets + "outputs/imagem_name.png"
```

{% endhint %}

In the text box, you must write on each line the correct name of the library you want to install (just the name, without any other characters, as shown in the image below). After choosing the Python version and libraries, simply click the "Install" button for your configurations to be executed.

<figure><img src="/files/cjJJq14QtjLPamQXM6jn" alt=""><figcaption><p>Python Task Environment Page</p></figcaption></figure>

As previously mentioned, we have a class called bucket, which connects to the clickhouse in an encapsulated way and has the query\_df, command, insert\_df and create\_df methods.

### **Examples**

Function that transforms a clickhouse select into a pandas dataframe in python.

```python
df = bucket.query_df('select columnA, columnB from table where columnB = 'active')
```

Function that makes a copy of a clickhouse table indicated to a pandas dataframe.

```python
df = bucket . select_df ( 'new_table' )
```

In the first line we have the function that creates a table in clickhouse that is similar to your pandas dataframe, in the second line we insert the data from your pandas dataframe into the clickhouse table.

```python
bucket . create_df ( 'new_table' , df )
bucket . insert_df ( 'new_table' , df )
```

Note that to perform the **insert\_df** function we need your pandas dataframe to be similar to your clickhouse table.

### Practical example

In this practical example we will go through the part of bringing the data into Python, performing grouping, saving an image in png format, saving the model file, and creating and saving the final table in clickhouse.

First, let's import the libraries that will be used

```python
import pandas as pd
from sklearn . cluster import KMeans
import matplotlib . pyplot as plt
import joblib
```

For this example we will use the famous iris table provided by several libraries such as scikit-learn. This table is in the clickhouse database within Gaio.

**select\_df** function to bring it to Python, and then apply the kmeans algorithm provided by the scikit-learn library.

```python
# Bring data into python
data = bucket . select_df ( 'iris_table' )

# Apply the K-Means algorithm with 3 clusters (number chosen arbitrarily)
kmeans = KMeans ( n_clusters =3 )
data [ 'cluster' ] = kmeans . fit_predict ( data )
​
# Evaluate the result - for example, viewing the means of each cluster
cluster_means = data . groupby ( 'cluster' ). mean ()
```

​In this next step, we will visualize the groups found by the model and save the figure in the **assets folder** .

```python
# Plot the clusters on a graph (considering only the first two columns)
plt . scatter ( data [ 'sepal_length_cm_' ], data [ 'sepal_width_cm_' ], c = data [ 'cluster' ], cmap = 'viridis' )
plt . xlabel ( 'sepal_length_cm_' )
plt . ylabel ( 'sepal_width_cm_' )
​
# Save the chart in png format
plt . savefig ( 'assets/cluster_iris.png' )
```

Now let's save this model so it can be reused at other times, for this we will use the joblib library.

```python
# Save the model
joblib . dump ( kmeans , 'assets/modelo_kmeans_iris.joblib' )
```

Now we can send the dataframe with the new column generated by the model to the clickhouse so that it can be used by other Gaio tasks. For this we will use **create\_df** and **insert\_df** .

```python
# Create a table in clickhouse similar to your dataframe
bucket . create_df ( 'tmp_iris_clusterizada' , data )
​
# Insert data from your dataframe into a clickhouse table
bucket . insert_df ( 'tmp_iris_clusterizada' , data )
```

### Using Parameters in Python Tasks

Python Tasks support **dynamic parameters**, allowing the same script to be reused with different inputs across executions, environments, or flows.

Parameters are resolved **at runtime** and injected into the script automatically.

#### 1. How Parameters Work

Parameters defined in the task configuration can be referenced directly inside the Python code using the following syntax:

```python
{{params.parameter_name}}
```

#### 2. Common Use Cases

* Dynamic file ingestion paths
* Table or schema selection
* Conditional execution logic
* Environment-based configuration
* Date-based processing

#### 3. Important Notes

* Parameter names are **case-sensitive**
* Always validate parameter values before using them in critical logic
* Avoid hardcoding values when parameters can be used instead

***

### Using Temporary Tables in Python Tasks

`bucket.tmp_context_table_name(table_name)`

Returns the name of a temporary table scoped to the current session, ensuring isolation between users and preventing naming conflicts in concurrent executions.

#### **Usage:**

```python
name = bucket.tmp_context_table_name('tmp_my_table')
bucket.command(f'CREATE TABLE {name} (...) ENGINE = MergeTree() ORDER BY tuple()')
```

#### Behavior

The function dynamically adjusts the table name depending on the execution context:

* **Contexts with session scope** (e.g., `file-import`, `source`, etc.):\
  `tmp_my_table` → `tmp_gaio{sessionId}_my_table`
* **Contexts without session scope** (e.g., `studio`, `cron`, `rest`, `api`):\
  `tmp_my_table` → `tmp_my_table` (no modification)

This mechanism guarantees that temporary tables created in session-based environments remain isolated and do not interfere with other users or processes.

#### When to Use

Use this function **whenever creating or referencing temporary tables (`tmp_`) in Python scripts**.\
It prevents table name collisions across concurrent sessions and ensures proper isolation in multi-user environments.

#### Complete Example

```
import pandas as pd

df = pd.DataFrame({
    'col1': [1, 2],
    'col2': ['a', 'b']
})

table = bucket.tmp_context_table_name('tmp_my_table')

bucket.create_df(table, df)

result = bucket.query_df(f'SELECT * FROM {table}')
print(result)
```


# Agent

The **Flow Agent** is an AI agent designed to operate **inside task and workflow contexts**, rather than direct user conversations. In this scenario the agent acts as a **Task-based Agent**, executed as part of an automated or analytical flow.

<figure><img src="/files/x6z6x5mo6eLltkj8ItqQ" alt=""><figcaption></figcaption></figure>

## How to Access the Flow Agent

The Flow Agent is accessed through the **Tasks** panel in the left sidebar.

1. Open the left navigation menu
2. Go to **Tasks**
3. Select a task category (e.g. Analytics)
4. Click on the agent after selecting a table or access it by right-clicking on a table and searching for Agent.

A Flow Agent is used when you need AI to:

* Process data as part of a workflow
* Analyze, classify, or transform inputs
* Operate without direct end-user interaction
* Produce structured outputs for downstream steps

Unlike Chat Agents, Flow Agents are typically:

* Triggered by tasks
* Driven by prompts and inputs
* Integrated into pipelines

## How to configure your Flow Agent

<figure><img src="/files/e6dQs8uUJwjZbrLYPZ4c" alt=""><figcaption></figcaption></figure>

The **General** tab shown in this panel uses the **same configuration model** as a Chat Agent:

* Name
* Description
* Role
* Goal
* Backstory
* Tools
* RAG access

Since these concepts are already covered in the[ **Chat Agent documentation**](https://docs.gaiodataos.com/~/revisions/S2YQM2SJIf46cxt3Uy9R/tools/agents), they are **not redefined here**.

### Tools and RAG in Flow Agents

Flow Agents can access:

* Tools (Discovery, Diagrams, HTTP Request, MCP, RAG)
* Knowledge bases (RAGs)
* Schemas and diagrams

Access control follows the same rules:

* Only explicitly enabled tools can be used
* Only attached RAGs can be consulted

This ensures predictable and secure execution inside workflows.

#### Key Difference from Chat Agents

| Aspect      | Chat Agent       | Flow Agent                |
| ----------- | ---------------- | ------------------------- |
| Interaction | Conversational   | Task / pipeline-based     |
| Trigger     | User message     | Task Execution            |
| Output      | Natural language | Structured or operational |
| Usage       | Front-facing     | Backend/Analytical        |

### Prompt Configuration

The **Prompt** tab defines **how the Flow Agent receives instructions and input data** during task execution.This is the core area where you specify **what the agent should do with incoming data** and **how it should reason over it**.

In a Flow Agent, the prompt is not written for direct user interaction, but for **deterministic execution inside a workflow**.

#### Purpose of the Prompt Tab

Use the Prompt tab to:

* Define the agent’s execution instructions
* Describe the expected input structure
* Control how data is injected into the prompt
* Ensure consistent and repeatable behavior

#### Prompt Tab Sections

The Prompt tab is composed of four main elements:

1. System Prompt
   1. Optional global instructions applied before any execution.
   2. Acts as a **system-level context**
   3. Useful for high-level constraints or global behavior
   4. Optional in most Flow Agent use cases
   5. Typical use cases:
      1. Enforcing strict output rules
      2. Applying compliance or formatting constraints
      3. Defining global execution policies
2. Loop Table
   1. Defines whether the agent should execute once or iterate over a table.
3. Prompt (Instructions)
   1. This is the main instruction block for the Flow Agent.
   2. Here you describe:
      1. The agent’s role for this specific task
      2. What it should analyze or transform
      3. How it should reason over the input

### Output Configuration

The **Output** tab defines **how and where the Flow Agent stores its execution results**. This configuration turns the agent’s response into a **structured artifact** that can be consumed by downstream tasks, analytics, or storage layers.

### Purpose of the Output Tab

Use the Output tab to:

* Persist agent results in a table
* Enforce a strict output schema
* Enable deterministic, machine-readable outputs
* Integrate AI results into pipelines and analytics

#### Output Destination

1. Save agent result at
   1. Choose where the agent output will be stored on a table or a parameter.
2. Table name
   1. Define the table where results will be written.
3. Select how the agent output will be stored as a text or JSON.
4. Insert mode: append records to table (optional)
5. Define output schema format

```json
 {
  "type": "object",
  "properties": {
    "name": { "type": "string" },
    "email": { "type": "string" },
    "score": { "type": "integer" },
    "description": { "type": "string" },
    "date": { "type": "string" },
    "category_1": { "type": "string" },
    "category_1_score": { "type": "number" }
  }
}

```

This schema ensures that:

* Every output follows the same structure
* Data types are enforced
* AI responses are compatible with analytics and storage

{% hint style="info" %}
Click **Generate** to auto-create a schema based on context.
{% endhint %}

## When to Use a Flow Agent

Use a Flow Agent when:

* AI is part of a data or automation pipeline
* Outputs must be deterministic or structured
* The agent supports downstream tasks
* No direct chat interface is required

## Best Practices for Flow Agent Outputs

* Always define an output schema for production workflows
* Prefer JSON for complex AI results
* Align output fields with downstream consumers
* Avoid free-text outputs in automated pipelines
* Version schemas when making structural changes


# AutoML antigo

<figure><img src="/files/PVpdvC1vhGEvE7bOt2gk" alt=""><figcaption></figcaption></figure>

Gaio uses technology to create predictive models H2O AutoML (Automatic Machine Learning). This means that Gaio operationalizes the connection to data, data processing, delivers training and modeling data and directives to H2O AutoML, retrieves the result of the execution and delivers the results in a user-friendly interface. This entire process can be automated within Gaio.

***

## How to Use the AutoML

***

### 1. Access the "AutoML" Task

In the left-side menu, go to **Analytics** and select the **AutoML** task.

***

### 2. Configure the Model

In the configuration screen:

* **Model Name**(optional): Enter a name for your model (e.g., `auto_ML`).
* **Table**: Select the data source table.
* **Target**: Choose the variable you want to predict (e.g., `status`).
* **Columns to remove**: If there are columns that should be excluded (such as IDs), list them here.
* **Training Time (Seconds)**: Estimated time the system will use to train the models.
* **Rows limit**: By default, Gaio uses up to 100,000 rows to train the model. You can adjust this, but higher values may overload the server.

{% hint style="info" %}
The modeling process is often memory and processing intensive. Therefore, special attention to the volume of rows in the table to be used is essential. A good one **sample** it is an excellent strategy as it generally represents the entire data set well and thus allows more models to be created in less time, in addition to not overloading the server. For large datasets, use the **Sample** task first to reduce volume and optimize performance.

By default, Gaio limits it to **100 thousand lines**, however it is possible to change this value, but it is necessary to be aware of the impact and it is only interesting in cases where the server is very large.
{% endhint %}

Click **Save and Train** to begin the process.

***

### 3. Track the Progress

While training, the interface displays two progress bars:

* **Preparation**: Data preprocessing stage.
* **Training**: Model construction and testing.

***

### 4. Techniques

Several techniques are used in the automatic modeling process. The following list contains the link to the official H2O documentation:

* GLM: Generalized Linear Model.
* XGBoost: Combination of multiple decision trees created in parallel.
* GBM: Gradient Boosting Machine.
* DeepLearning: use of Neural Networks.

Training and validation criteria are applied. Gaio uses Cross-Validation to evaluate whether the models are being assertive. A 5-Fold is used to generate 5 random samples of the same size that will be used to train several models, as shown in the image below:

<div align="center"><img src="/files/Yh6faJihYFGejHgsfieT" alt=""></div>

The criterion for prioritizing the model is **Accuracy** .

Categorical (text) and Numeric are accepted as response variables. In the case of a numerical variable, it will always be considered that the desire is to predict the number and not to indicate the probability of that event occurring.

{% hint style="info" %}
If the response variable is, for example, **Service Cancellation** and has values 0 or 1, it will be necessary to transform the values in this column into, for example, R0 or R1. This is because in this case we expect to know the probability of the customer canceling, that is, being 1 and at the same time the probability of the customer being 0, not canceling. However, as it is a numerical variable, Gaio understands that the intention is to predict a number, such as the **amount that the customer can purchase** . Different techniques and different results are applied to the two different types of response variable.
{% endhint %}

### 5. Review the Results

<figure><img src="/files/WKshzH2OiRrPhqybKFXY" alt=""><figcaption></figcaption></figure>

Once completed, the system will display a full report including:

* **Summary:** A summary of the automatic model building process is generated, and the overall quality of the model is reported.
  * **Model Accuracy**: Shows the accuracy of the best model created.
  * **ROC Curve**: A visual representation of model performance.
  * **Most Important Variables**: Lists the top predictive features in order of importance.
* **Models:** The list of all models that were created in the predetermined time with some model quality statistics.
* **Supporting Tables**:
  * **Cross Validation**
  * **Confusion Matrix**
  * **Gain Table**
  * **Maximum Metrics**

***

### 6. Apply the Model

The trained model is saved and can be reused through the **Scoring** task to apply predictions to new data.

***

## 3. Results

After executing the **AutoML task** , the results are made available in a new object in the process. Below is an example whose response variable is categorical.

![](/files/sdHGTNM4Xws63DyaRdUQ)

1.
2. The variables that most impacted the model are ordered. In the example above, Age was the variable that most contributed to predicting the event, reaching a 57.3% contribution.
3. The Summary screen is standard when entering the model result and provides the main information about the model chosen as the best.
4. The confusion matrix indicates the percentages of correct answers for each value of the categorical response variable (see image below).
5.

![](/files/CY9ANMeTlnRCfkYAy9Bu)

Circled in green are the model hits, where it coincided with what happened in the past. The red circles signal where the model made a mistake, differing from what happened in the past. In this example above, when the model says (first line) that the customer will **not** cancel, it gets it wrong 5 times and therefore gets 99.2% correct. However, when the model predicts that the customer **will** cancel, it is wrong 26 times, resulting in a 92.4% success rate. Overall, the accuracy (degree of success) is 97.3%.

![](/files/JdiTbHLGw85Nuy60QFih)

In this run, 16 different models were generated, which are ordered from best to worst. In the columns on the right, some model quality indicators are presented , including the AUC (Area Under the curve) and the RMSE (Root Mean Square Error).


# Time Series antiga

<figure><img src="/files/pIUyAzbj4pNpWqcU7Xdz" alt=""><figcaption></figcaption></figure>

Predict sales behavior in the coming months. This is an application of **Time Series**. In essence, the technique relies on a date column and a metric, to analyze three factors:

1. **Seasonality:** peaks at certain cyclical moments (e.g. Christmas).
2. **Trend:** analyzes the speed of growth, decline or stagnation.
3. **Amplitude:** if there are rises and falls over time, it measures whether the distances between peaks and valleys have intensified or not.

Gaio can project the next **months** or **days**. Gaio uses the Facebook algorithm, Prophet, to perform calculations.

Various techniques and parameterizations are applied to the data, generating several projections and their errors are calculated. The model with the lowest error is chosen and the projections are saved in a table in Gaio.

## 1. Settings

To make projections, click the table that contains a date column and the metric you want to project. Under Tasks, click **Time Series**.

![](/files/abMjPruyAbBcADokahGx)

1. Define the name of the table to be generated with the projections.
2. Select the column that has the date that will be used for modeling and your sequence will be projected.
3. **Measure** : a numeric column must be entered in this location so that it can be projected. If the table is not aggregated, Gaio will add the values in this column automatically.
4. **Frequency** : you can choose whether projections are made daily or monthly.
5. **Classification** : This field is optional. If any column is entered, Gaio will build a series for each value. Example: salesperson. Gaio will calculate as many series as there are salespeople in the company.
6. **Period** : define how many periods (days or months) you want to be projected.

## 2. Results

The result of executing the Time Series brings a set of columns according to the image below:

![](/files/vYQDSzTJnFfXNFCybu0Y)

1. **category** : if a column has not been defined in the **Classification item** in the table configuration, this column will have the value **nd** in all rows. If you have defined, for example **, State** as the **Classification column** , for each State there will be a large set of rows in this generated table. For States with less than two lines, no series will be generated.
2. **dt** : column of dates in the historical table that also has future dates for projections.
3. **real** : historical values of the column chosen as **Measure** in Configuration.
4. **type** : **receives the actual** and **forecast** values , to separate the historical period from the projection period.
5. **forecast:** This column has values for all lines, historical and forecast **.** This is because the model makes projections for the entire past, where it can calculate how far from reality the projections are.
6. **lower** : lower limit of projections.
7. **upper** : upper limit of the projections.

## 3. Visualization

It is generally desired to present the series and its projection graphically. In the [Report ](https://app.gitbook.com/o/0AwHT1YPyV5KV6qHeJNz/s/-MPpFa6rq60XeC7QMDh7/documentacao-1/studio/tarefas/delivery/relatorio)task, there is an exclusive graph for **Time Series** .

To create a chart when only one series was projected (without a column in the **Classification** ), go to Reports, drag all the fields except the **category** and sort in ascending order by the **dt column** , the date. Then choose the graphic in the image below:

![](/files/Vv37zcCfArJkoz3KF4tl)

The result should be something similar to the graph below. The blue balls are the actual historical results. The green line is the model, which is applied to the past and future, generating projections.

![](/files/Zpa2LkCBC2J7p1zN28zc)


# Copy of Principal Components

<figure><img src="/files/TQ8EsD1lmpCmF5bMZloO" alt=""><figcaption></figcaption></figure>

When you have a large set of columns (mainly numeric), it may be interesting to reduce them to a few columns that will well represent the variability existing in the different columns.

One method for this is Core Components. Gaio uses [H2O ](http://docs.h2o.ai/h2o/latest-stable/h2o-docs/data-science/pca.html)to perform the calculations and summarize the data in a few columns. The algorithm accepts both numeric and categorical variables.

***

## How to Use the PCA Task

***

### 1. **Open the Principal Component Analysis Task**

* In the **Studio**, go to the **Tasks** panel.
* Under the **Analytics** section, select on **Principal Component Analysis**.

***

### 2. **Configure the Main Fields**

* **Task label**: (optional) Name for identifying this step in your flow.
* **Result table:** Output table that will contain the principal components. Example: pca.
* **Source table:** Automatically populated with the selected table (e.g., `new_sales`).
* **Components amount:** define how many principal components you want to extract.

***

### 4. **Select Columns to Remove (Optional)**

* In **Columns to remove**, you can exclude columns that should **not** be considered in the PCA calculation (e.g., IDs, codes, irrelevant fields).
* This helps avoid bias and improves the quality of the results.

***

### 5. **Save and Execute**

* After setting the configuration, click **Save**.
* Run the flow — the output table will contain the extracted principal components.

***

#### Output

The resulting table will include:

* The main components are presented in the first columns and then all the columns of the source table.
* One or more columns representing the **principal components** (e.g., `PCA_1`, `PCA_2`, etc.)
* A simplified dataset ready for further use in tasks like **Clustering**, **AutoML**, or 2D visualizations

***

#### ✅ Best Practices

* Use PCA to:
  * Reduce the number of variables in datasets with many numeric features
  * Optimize performance of clustering or classification algorithms
  * Simplify visualizations when working with high-dimensional data
* Combine PCA with tasks that benefit from dimensionality reduction, such as **Cluster** or **Forecast**

![](/files/DWS11CqyKK7l9Gvo8qjZ)

In this example, as 5 components were defined, five columns were created.

{% hint style="info" %}
A report is being developed that will provide a diagnosis of the components created. For now, they are only generated, but it is not possible to identify what percentage of the data variability was concentrated in each component.
{% endhint %}


# Delivery


# Report

<figure><img src="/files/taEDdvfrcMkUz5XXlu4A" alt=""><figcaption></figcaption></figure>

This is the second most important task within Gaio. With it, you can build different types of graphs and customize a table with statistics on your data.

It is generally used in **Dashboard**-type processes, as they will be accessed by users who do not have access to the Studio of that application.

{% hint style="info" %}
It is super important to carefully evaluate the construction of the process that will be a dashboard. If many queries are carried out, it can slow down those who access the dashboard. A good practice is to prepare the data in a previous process (which can be automated to update the data) and in this process where reports are inserted, only one query is used, in which filters are applied that will allow the user to filter the data on the dashboard.
{% endhint %}

{% hint style="info" %}
It is not possible to create Reports directly on tables from external sources (e.g.: Oracle, MySQL, SQL Server, etc.). Only in tables that are already in Gaio (red tables).
{% endhint %}

***

## **How to Use**

***

### **1. Access the Report  task**

* Add a **Table** to your flow and choose the dataset you want to work with.
* The Report task will only become available once a table is selected.
* In the **Studio**, go to the **Tasks** panel.
* Go to **Delivery > Report** in the task menu.

***

### **2. Configure Basic Info**

* **Task label**: (optional) Add a name for the task to identify it in your flow.
* **Source tab:**&#x20;
  * You will see the available fields in the table.&#x20;
  * Drag the desired fields to use them as **Dimensions** or **Measures**.
  * View data in table format before chart creation.
* **Computed tab** to create custom calculated columns.

***

### 3. Define the Visualization Type

Click on the **Type** tab.

<figure><img src="/files/c3utwJ03wSEXlLcu45vz" alt="" width="375"><figcaption></figcaption></figure>

Choose the type of visualization you want to create:

* **Table** or **Pivot Table**
* **Charts**: Column, Line, Area, Pie, Donut, Radar, Heatmap, Word Cloud, and others
* **Forecast**: useful for time series

When you click on the desired type, it will be applied to the current view.

***

### 4. Customize the Report

Use the right-hand panel with the following tabs for customization:

* **Report**: general settings
* **Theme**: visual themes
* **Field**: specific field editing (formatting, labeling, sorting)

***

### 5. Customize Appearance and Behavior

Use the **Report** tab on the right to refine the look and behavior of your visualization. The options vary depending on the selected chart type. For example, if you’re working with a **Stacked Bar**, you can adjust:

* **Header**: Title text and positioning
* **Legend**: Show/hide, placement, and style
* **Label**: Enable or disable value labels on elements
* **Tooltip**: Define what appears on hover
* **X Axis / Y Axis**: Customize labels, rotation, size, visibility
* **Link**: Add interactivity (e.g., open another page on click)
* **Margin**: Set spacing around the chart
* **Rows Displayed**: Limit how many rows are shown
* **Watermark:** Enable watermark in the form of text or an image
* **Message**: Custom message for no-data or loading states

***

### 6. Save and Publish

Once your configuration is complete:

* Click **Save** to store the chart
* Optionally, embed the chart in a dashboard or export it

Your report is now ready to be shared and used for monitoring or presentation.

#### **Tips**

* It is possible to apply filters to the report that will always be used regardless of the user's choice. For example, it is possible to filter the sales of the user who logged in to Gaio (using Parameters). This way he will only see his sales.
* It is possible to place a link in the specific column that will call another process, passing all the values in the row as aparameterso that this process, for example, can filter the data or use it for others.
* In the Report settings, in addition to several other features, it is possible to create a button that opens forms, that is, the user can enter information regarding that line. This feature opens up a wide range of possibilities, where the user can:
  * Update that row from the source table
  * Delete that line
  * Send a message
  * Simulate a scenario related to that line
  * Among many other possibilities in building the process that will be called from this button

{% hint style="warning" %}
**Hidden columns** In the report, it may be desired to include a Link (will be explained below). All report column values ​​will be passed, however, it may be necessary to pass values ​​for columns that should not be displayed. Therefore, this column will appear in the area at the top, however it will not appear in the table/graph. This hide option is in the menu on the right, which also presents the settings for the selected columns.
{% endhint %}


# Content

<figure><img src="/files/OQ3J04x9SbX4y6yaLLnb" alt=""><figcaption></figcaption></figure>

The **Content** component allows you to build **custom visual elements** using **HTML**, **CSS (Style)**, and **JavaScript (Script)**. It's a powerful tool for creating **dynamic dashboards**, **interactive interfaces**, and **customized data presentations**, all within the Gaio platform.

This task gives a lot of flexibility to users who have programming skills.

***

## &#x20;**How to Use the Content Editor**

***

### 1. **Select the Content Component**

* In the left-side panel under **"Delivery"**, drag the **Content** task into your flow.
* Link it to the tasks or tables whose data you want to use.

***

### 2. **Configure the Task**

**Task label**: (optional) Name for identifying this step in your flow.

**HTML Tab (Visual Structure):** Use this tab to build the structure of your output.

**Script Tab (JavaScript Logic):**&#x20;

* Access your data tables via the `context` object.
* You can dynamically insert values into your HTML.

**Style Tab (CSS Styling):**&#x20;

* Customize the appearance of your content.

{% hint style="info" %}
Even with the tabs with the names of the languages, the user can use all three in the same code.
{% endhint %}

**Context:** To use data from existing tables in Gaio, they must be flagged. To do this, mark each table that will be used so that Gaio makes their data available in this task.

**Options:**&#x20;

* The visual result of the code whether it has a border or not. The idea of the border is to generate a box in the object. Without a border, the text blends into the background, but for example when using images, it is more interesting not to have a border.
* Library: Here you select which library you want to use.

**Content:** Here you can view images, PDFs and other files uploaded to Gaio. In this content task, it is possible to present images, PDFs, videos, maps and whatever the code allows.

***

### 3.  **Preview and Display Settings**

* The **Result** tab shows a live preview of your rendered output.
* You can combine data from multiple tables, apply calculations, and display results in real time.
* You can control:
  * **Width (%)** – How much horizontal space the component uses.
  * **Height (px)** – Vertical size of the result frame.
* Whenever you place codes in the black box, you need to press the **Run** button to view the result below.

***

#### **Best Practices**

* Keep your HTML and JS modular and clean.
* Always check for null or undefined data before using.
* Use `console.log()` for debugging when needed.


# Report Static Query Builder

### Overview

The `MiniQueryBuilder` is a fluent interface for building SQL-like queries in Gaio Data OS. It provides a simple and intuitive way to construct queries with various clauses like SELECT, FROM, WHERE, GROUP BY, ORDER BY, LIMIT, and OFFSET.

### Basic Usage

```js
// Access the query builder through context.query
const results = await context.query
  .select(['id', 'name', 'created_at'])
  .from('users')
  .filter('status', 'eq', 'active')
  .orderBy('created_at', 'desc')
  .limit(100)
  .run();
```

### API Reference

#### Constructor

The query builder is accessed through the context object:

```ts
// You don't need to create an instance - use context.query
const query = context.query;
```

#### Methods

**select(fields: string\[])**

Specifies the fields to select in the query.

```js
context.query.select(['id', 'name', 'email']);
```

**from(table: string)**

Specifies the table to query from. This method is required.

```js
context.query.from('users');
```

**filter(field: string, operator: FilterOperator, value: any)**

Adds a filter condition to the query.

```js
context.query.filter('age', 'gt', 18);
```

Available operators:

* `eq` - equals
* `neq` - not equals
* `gt` - greater than
* `gte` - greater than or equal
* `lt` - less than
* `lte` - less than or equal
* `like` - pattern matching with %
* `ilike` - case insensitive pattern matching
* `in` - in a list of values
* `is` - checking for null
* `cs` - contains (for arrays)
* `cd` - contained by (for arrays)
* `ov` - overlap (for arrays)
* `fts` - full text search
* `or` - logical OR
* `and` - logical AND

**groupBy(fields: string\[])**

Specifies fields to group by.

```js
context.query.groupBy(['department', 'role']);
```

**orderBy(field: string, direction: 'asc' | 'desc' = 'asc', nullsPosition?: 'first' | 'last')**

Adds an order by clause to the query.

```js
context.query.orderBy('created_at', 'desc', 'last');
```

**limit(limit: number)**

Sets the maximum number of rows to return.

```js
context.query.limit(100);
```

**offset(offset: number)**

Sets the number of rows to skip.

```js
context.query.offset(50);
```

#### run(): Promise\<GenericType\[]>

Executes the query and returns a Promise that resolves to an array of results. This is the primary method for executing the query and retrieving data.

**Usage**

```js
const results = await context.query
  .select(['id', 'name'])
  .from('users')
  .limit(100)
  .run();
```

**Return Value**

Returns a Promise that resolves to an array of objects (GenericType\[]) representing the query results. Each object in the array corresponds to a row in the result set, with properties matching the selected columns.

**Validation**

The `run()` method performs the following validations before executing the query:

* Ensures that the limit is a number
* Ensures that the limit does not exceed 10,000 rows
* Implicitly checks that the FROM clause is specified (through the build method)

**Error Handling**

The `run()` method may throw errors in the following cases:

* If the limit is not a number: `Error('Limit must be a number')`
* If the limit exceeds 10,000: `Error('Limit must be less than 10000')`
* If the FROM clause is not specified: `Error('FROM clause is required. Use .from() to specify a table.')`
* If the API request fails: The error from the API client will be propagated

**Implementation Details**

The `run()` method sends a POST request to `api/table/query` with the query schema and task data. It then extracts and returns the data from the response.

### Examples

#### Basic Query

```js
const users = await context.query
  .select(['id', 'name', 'email'])
  .from('users')
  .limit(100)
  .run();
```

#### Filtered Query

```js
const activeUsers = await context.query
  .select(['id', 'name', 'email'])
  .from('users')
  .filter('status', 'eq', 'active')
  .run();
```

#### Aggregation Query

```js
const departmentCounts = await context.query
  .select(['department', 'COUNT(*) as count'])
  .from('employees')
  .groupBy(['department'])
  .orderBy('count', 'desc')
  .run();
```

#### Pagination

```js
const page = 2;
const pageSize = 50;

const paginatedUsers = await context.query
  .select(['id', 'name', 'email'])
  .from('users')
  .orderBy('id', 'asc')
  .limit(pageSize)
  .offset((page - 1) * pageSize)
  .run();
```


# Nunjucks Documentation

Nunjucks is a powerful templating engine for JavaScript that allows you to create dynamic content using variables, filters, and control structures.

### Available Context

In this environment, you have access to the following context object:

```js
{
  params: {}, // Query parameters
  table: {    // Contains all available tables
    tableExample: [], // Each table is a list of objects
    anotherTable: []
  }
}
```

### Basic Syntax

**Variables**

Access variables using double curly braces:

```
{{ params.name }}
{{ table.tableExample[0].id }}
```

**Conditionals**

```
{% if params.showDetails %}
  Showing details for {{ params.id }}
{% else %}
  No details available
{% endif %}
```

**Loops**

```
<ul>
{% for row in table.tableExample %}
  <li>{{ row.name }}: {{ row.value }}</li>
{% endfor %}
</ul>
```

### Filters

Modify variables with filters using the pipe symbol:

```
{{ params.name | upper }}
{{ params.date | date("YYYY-MM-DD") }}
{{ table.tableExample[0].amount | round(2) }}
```

Common filters:

* `upper`, `lower`: Change case
* `trim`: Remove whitespace
* `first`, `last`: Get first/last item
* `length`: Get length of array/string
* `sort`: Sort an array
* `join`: Join array elements

### Expressions

```
{{ table.tableExample[0].price * 1.1 }}
{{ "Price: " + table.tableExample[0].price }}
{{ table.tableExample.length > 0 ? "Has items" : "Empty" }}
```

### Comments

```
{# This is a comment that won't be rendered #}
```

### Practical Examples

**Formatting a table:**

```
<table>
  <thead>
    <tr>
      {% for key in Object.keys(table.tableExample[0]) %}
        <th>{{ key }}</th>
      {% endfor %}
    </tr>
  </thead>
  <tbody>
    {% for row in table.tableExample %}
      <tr>
        {% for key in Object.keys(table.tableExample[0]) %}
          <td>{{ row[key] }}</td>
        {% endfor %}
      </tr>
    {% endfor %}
  </tbody>
</table>
```

**Conditional formatting:**

```
{% for item in table.tableExample %}
  <div class="{% if item.value > 100 %}highlight{% endif %}">
    {{ item.name }}: {{ item.value }}
  </div>
{% endfor %}
```

**Using params for filtering:**

```
{% if params.filter %}
  <h3>Filtered results for: {{ params.filter }}</h3>
  {% set filteredRows = table.tableExample | filter(row => row.category == params.filter) %}
  {% for row in filteredRows %}
    <div>{{ row.name }}</div>
  {% endfor %}
{% else %}
  <h3>All results</h3>
  {% for row in table.tableExample %}
    <div>{{ row.name }}</div>
  {% endfor %}
{% endif %}
```

**Accessing multiple tables:**

```
<div>
  <h3>Table 1: {{ table.tableExample.length }} rows</h3>
  <ul>
    {% for row in table.tableExample %}
      <li>{{ row.name }}</li>
    {% endfor %}
  </ul>
  
  {% if table.anotherTable %}
  <h3>Table 2: {{ table.anotherTable.length }} rows</h3>
  <ul>
    {% for row in table.anotherTable %}
      <li>{{ row.title }}</li>
    {% endfor %}
  </ul>
  {% endif %}
</div>
```

**Aggregating data:**

```
{% set total = 0 %}
{% for item in table.tableExample %}
  {% set total = total + item.amount %}
{% endfor %}
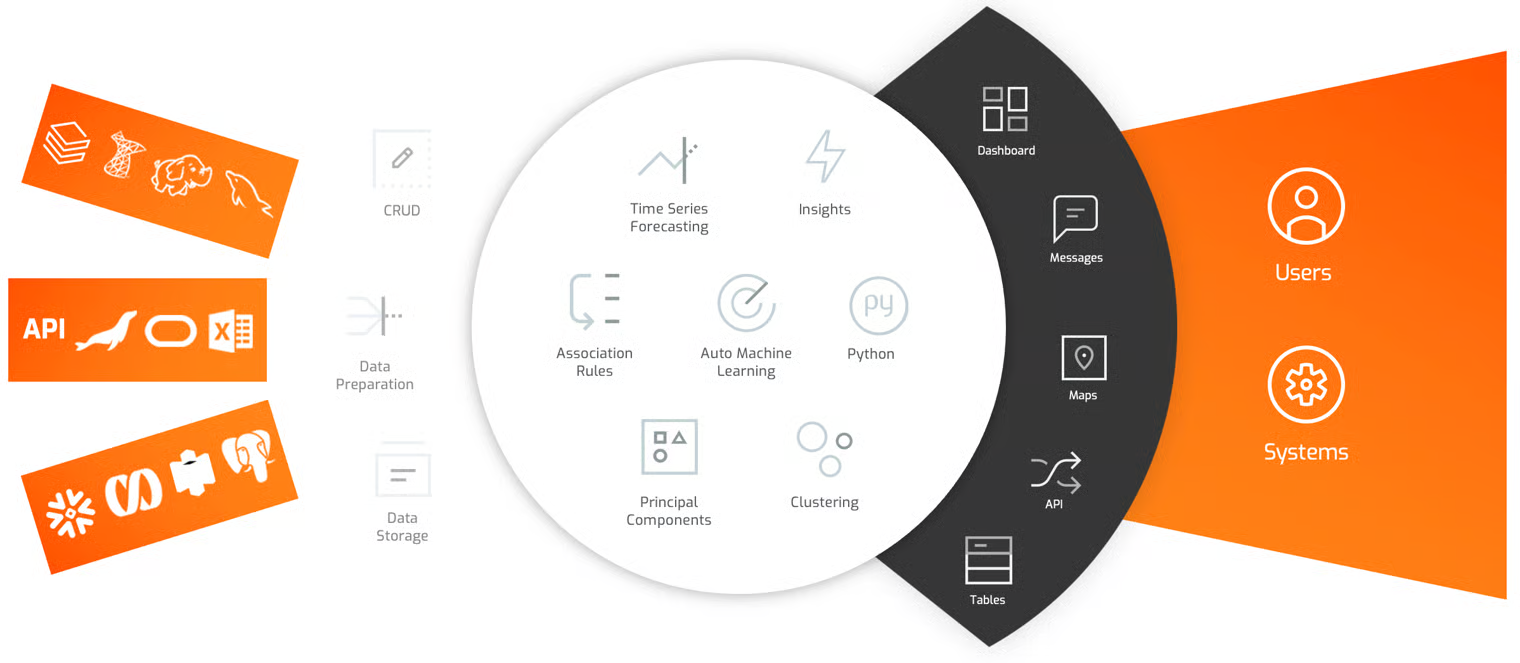
<div>Total: {{ total }}</div>
```

For more information, visit the [Nunjucks documentation](https://mozilla.github.io/nunjucks/templating.html).


# Context Helper Documentation

The `context` object provides a powerful interface for accessing data and performing actions within the Report Static Query Builder. It's available globally as `window.context` and contains several key components.

### Structure Overview

```js
{
  params: {},       // Query parameters
  table: {},        // Available tables with data
  flow: Function,  // Load or open a flow
  form: Function,  // Open a form
  query: {}         // Query builder object
}
```

### Components

**params**

The `params` object contains all query parameters available to the current report.

```js
// Example
context.params.userId = "12345";
context.params.startDate = "2023-01-01";
```

**table**

The `table` object contains all available tables, where each table is a list of objects.

```js
// Example
const firstUser = context.table.users[0];
const totalSales = context.table.sales.reduce((sum, sale) => sum + sale.amount, 0);
```

**flow()**

The `flow()` function allows you to load or open another flow from the current report.

**Parameters:**

```js
context.flow({
  flowId: "flow123",                // Required: ID of the flow to load
  executionType: "loadFlow",        // Required: "loadFlow" or "openFlow"
  reloadCurrentFlow: true,          // Optional: Whether to reload the current page after loading the flow
  reloadCurrentContent: true,       // Optional: Whether to reload the current content after loading the flow
  resetParams: false,               // Optional: Whether to reset params to default after loading the flow
  params: [                         // Optional: Parameters to pass to the flow
    {
      paramName: "userId",
      paramValue: "12345"
    },
    {
      paramName: "view",
      paramValue: "detailed"
    }
  ]
});
```

**executionType options:**

* `openFlow`: Opens the chosen flow in the dashboard
* `loadFlow`: Loads the chosen flow in the background

**form()**

The `form()` function allows you to open a form from the current report.

**Parameters:**

```js
context.form({
  formId: "form123",               // Required: ID of the form to open
  params: [                        // Optional: Parameters to pass to the form
    {
      paramName: "userId",
      paramValue: "12345"
    },
    {
      paramName: "mode",
      paramValue: "edit"
    }
  ]
});
```

**query**

The `query` property provides access to the query builder object. This powerful feature allows you to construct and execute queries programmatically.

> **Note:** For detailed documentation on the query builder functionality, please refer to the Query Builder documentation in the other tab.

### Practical Examples

**Navigating between flows based on a condition:**

```js
if (context.table.users.length > 0) {
  context.flow({
    flowId: "userDetailsFlow",
    executionType: "flow",
    params: [
      {
        paramName: "userId",
        paramValue: context.table.users[0].id
      }
    ]
  });
} else {
  context.flow({
    flowId: "noUsersFlow",
    executionType: "openFlow"
  });
}
```

**Opening a form with data from the current context:**

```js
// Open an edit form for the first product in the table
context.form({
  formId: "productEditForm",
  params: [
    {
      paramName: "productId",
      paramValue: context.table.products[0].id
    },
    {
      paramName: "category",
      paramValue: context.params.currentCategory
    }
  ]
});
```

**Loading a flow in the background and then reloading the current page:**

```js
// Update data in the background and then refresh the current view
context.flow({
  flowId: "dataUpdateFlow",
  executionType: "loadFlow",
  reloadCurrentFlow: true,
  reloadCurrentContent: true,
  resetParams: false
});
```

### Best Practices

1. **Parameter Management**: When passing parameters to flows or forms, only include the parameters that need to change from the current context.
2. **Error Handling**: Always ensure that the required IDs (flowId, formId) are valid before calling the respective functions.
3. **User Experience**: Consider using `reloadCurrent: true` with caution as it will refresh the user's current view.
4. **Performance**: When working with large tables, consider processing the data before navigating to another flow to minimize the data transfer.


# Form Card

Embedding Forms in Dashboards

<figure><img src="/files/dk5BoBq5uYEzkwtzRn2G" alt=""><figcaption></figcaption></figure>

The **Form Card** feature in Gaio DataOS allows you to embed interactive forms directly into dashboards, making it easy to collect inputs from users. This is ideal for applying filters, submitting parameters, or creating dynamic user experiences.

{% hint style="info" %}
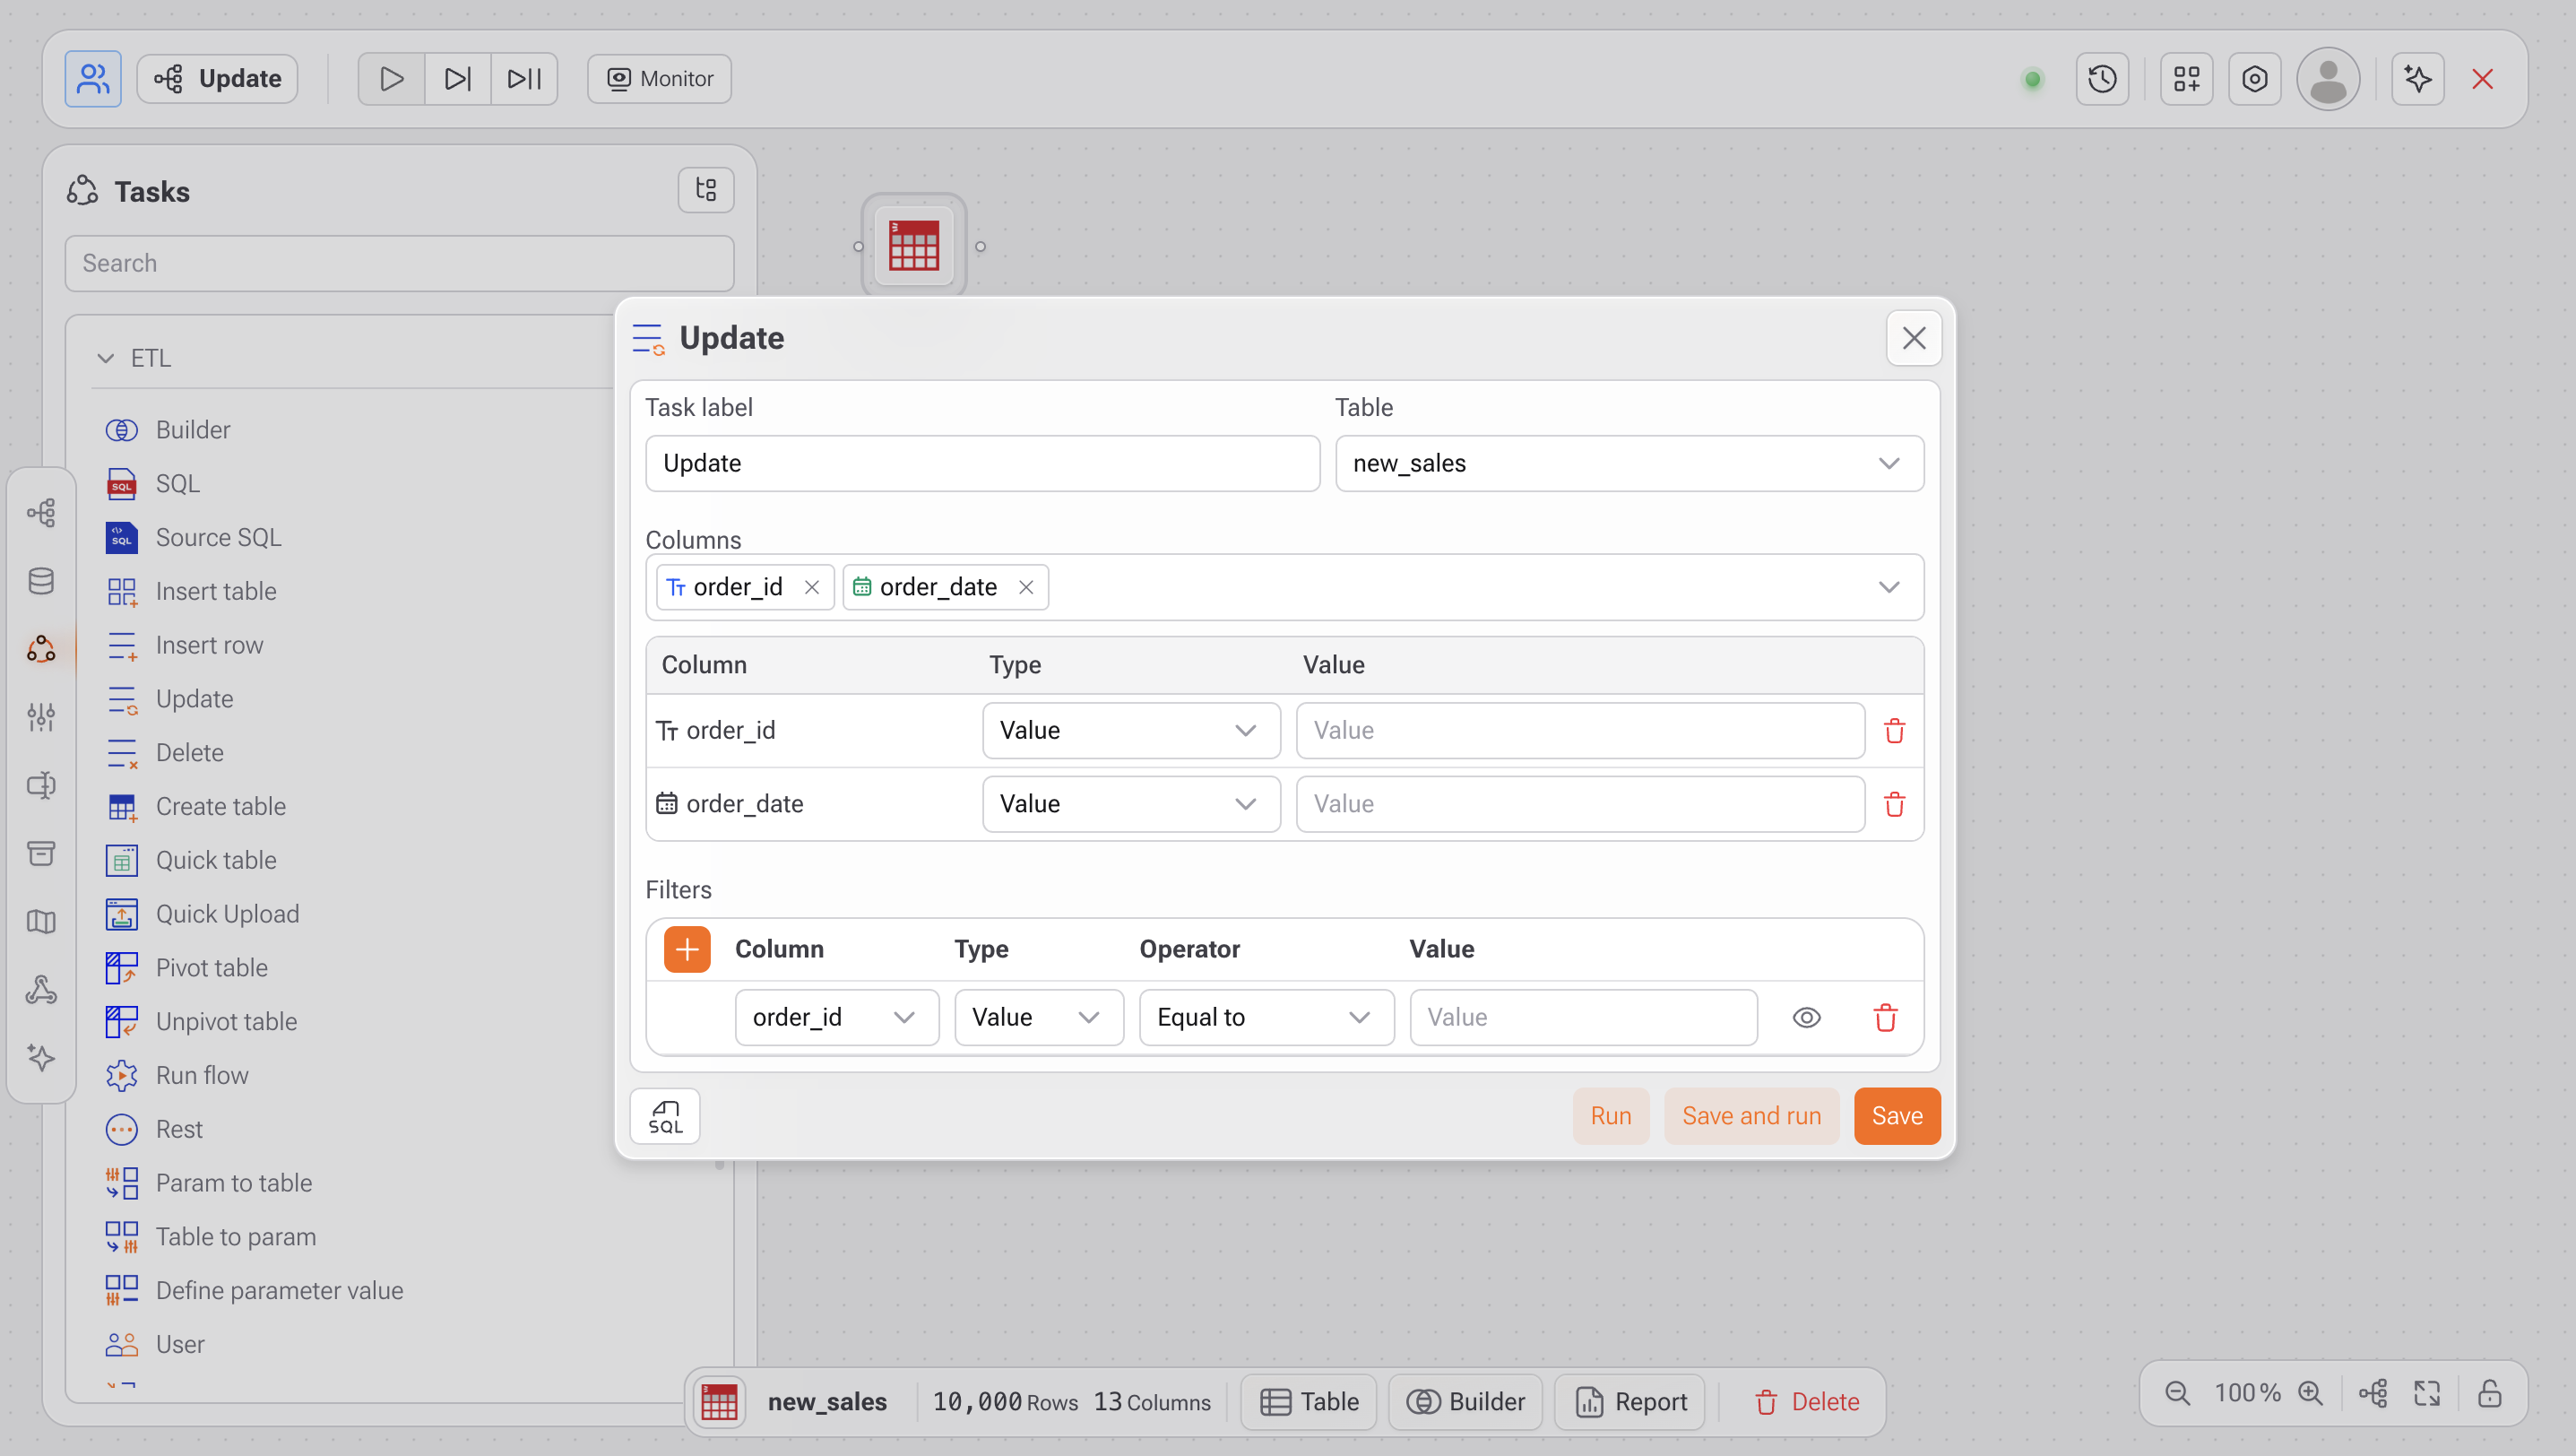
A dashboard can have more than one form, including different forms of presentation, such as a button, an open form on the dashboard and a hidden form in the menu to the right of the dashboard.
{% endhint %}
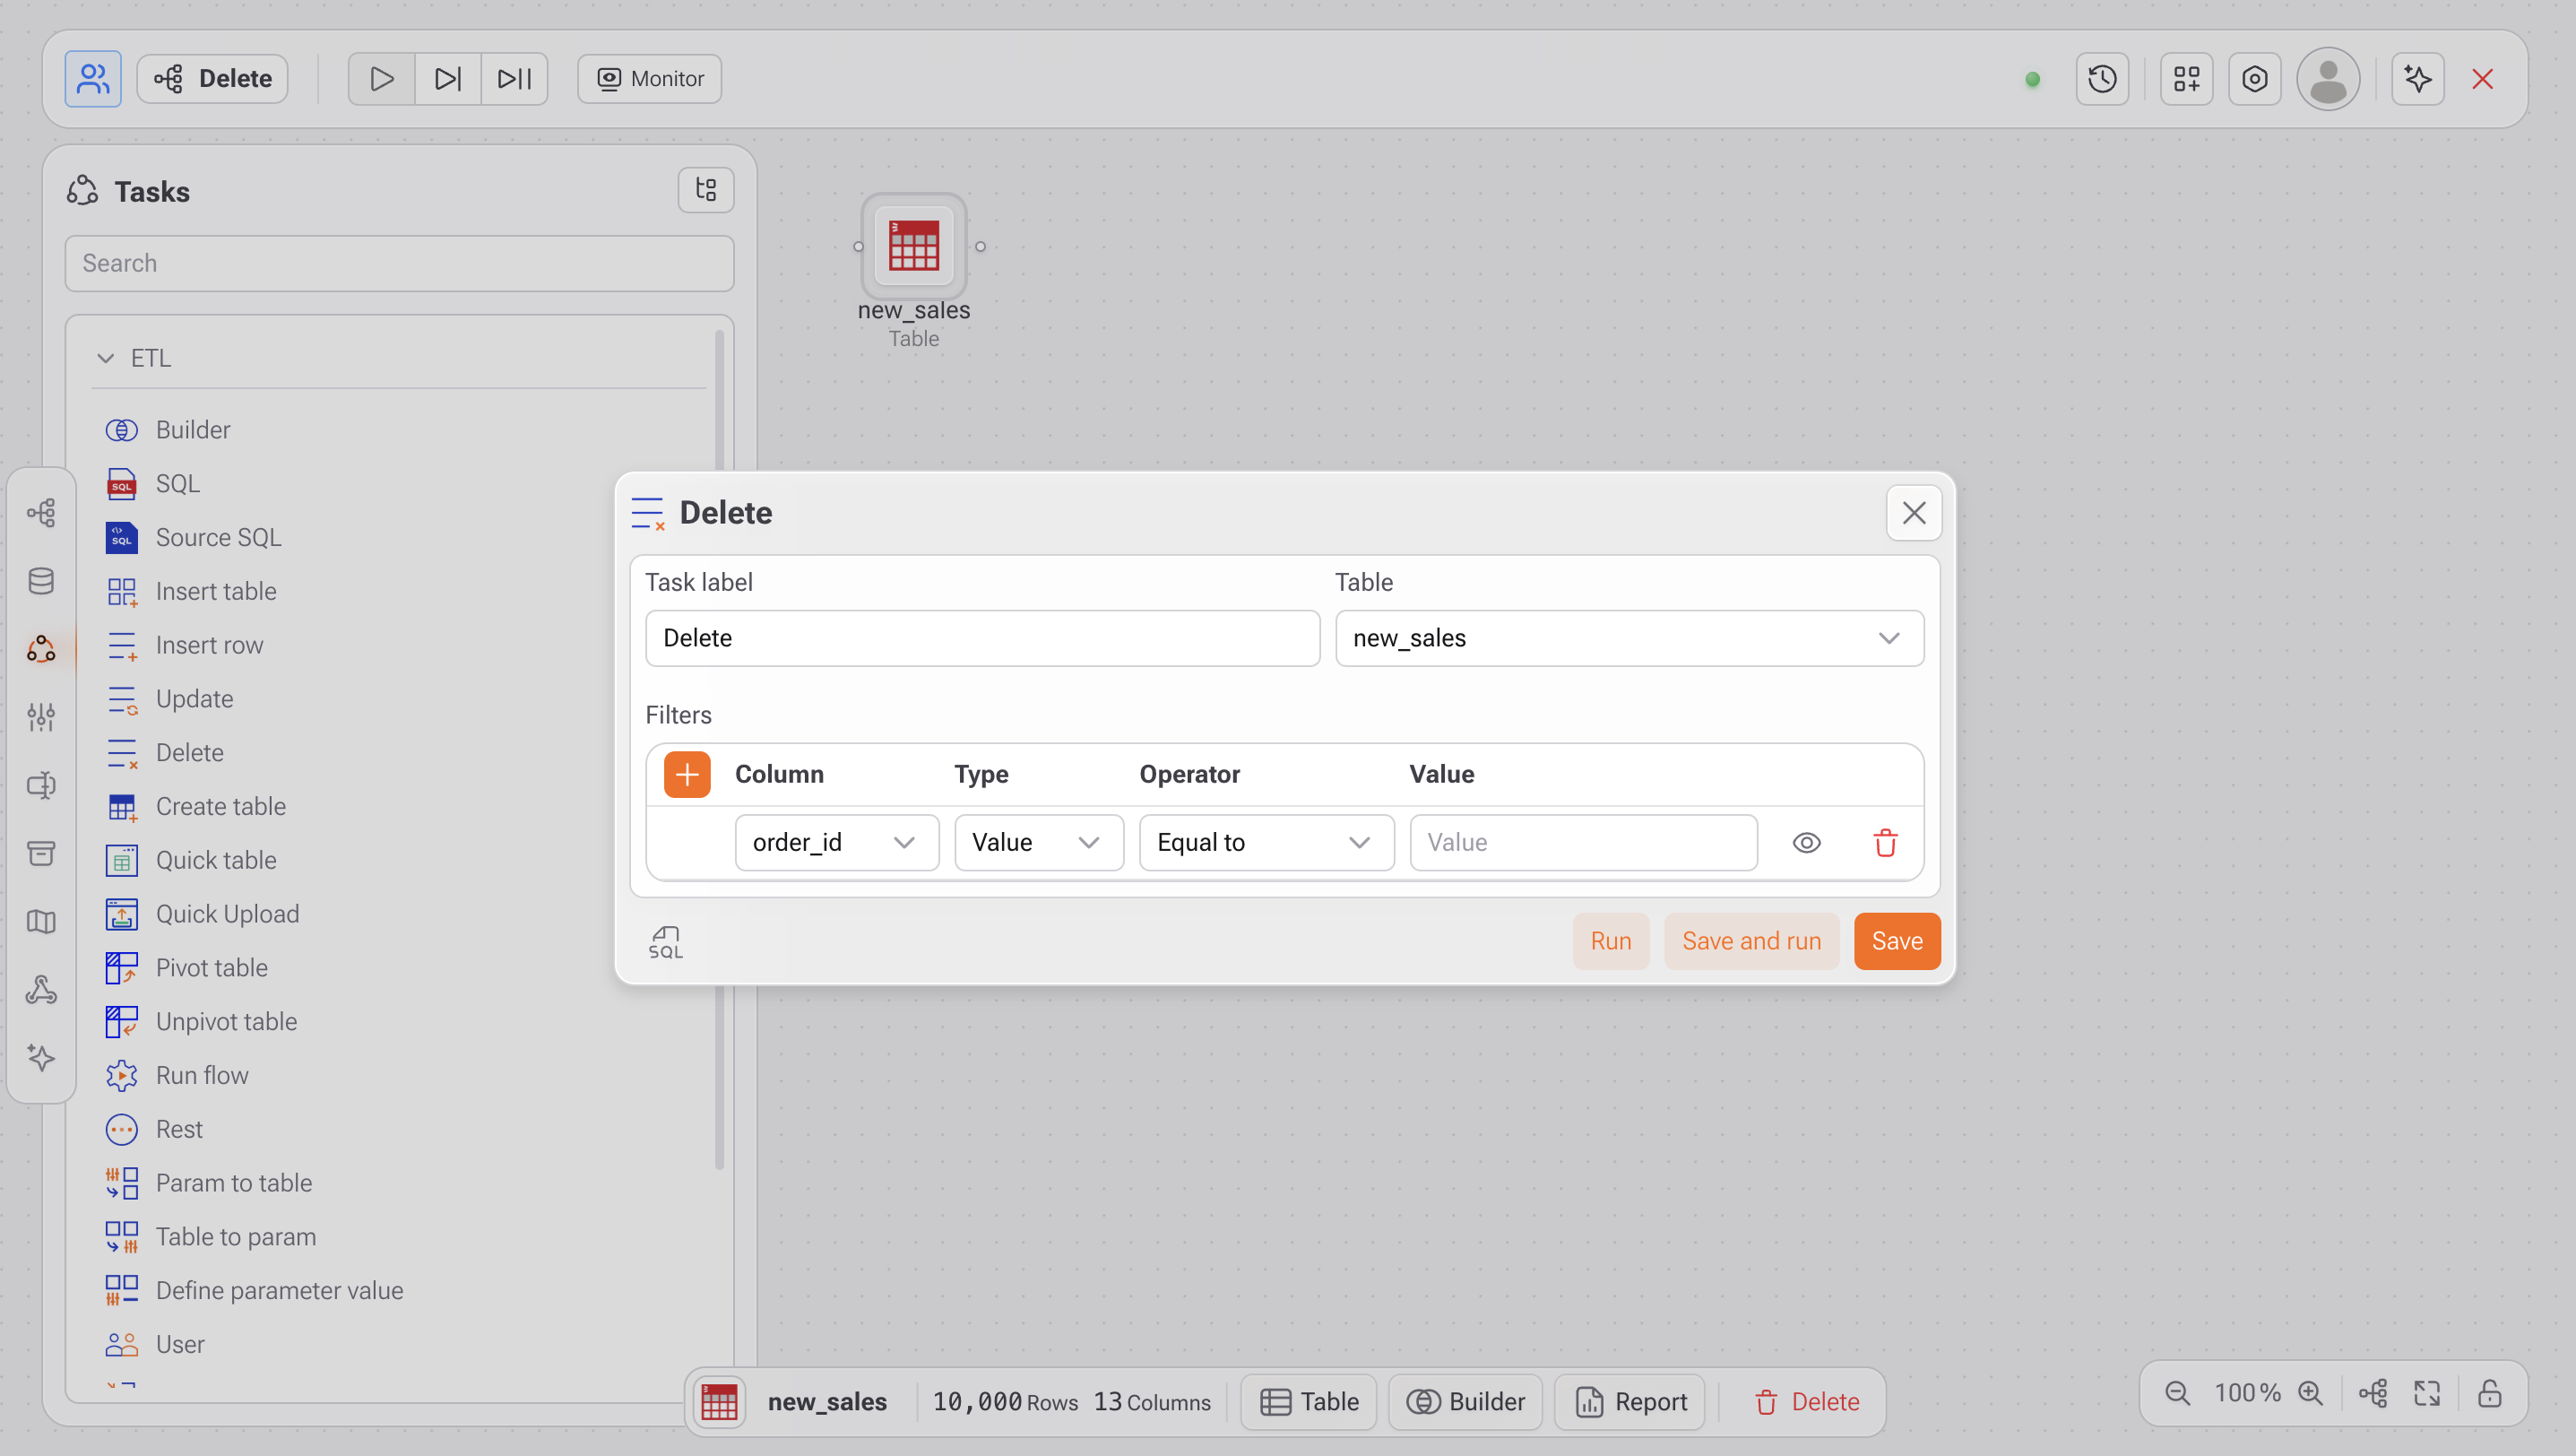
***

## &#x20;**How to Use**

***

### **1. Add the Form Card to the Flow**

* Go to **Delivery > Form** in the task menu.
* Drag the **Form Card** into your process flow.

***

### **2. Configure the Card**

* **Label**: Set a name for the card (e.g., “Sales Filter”).
* **Form**: Choose the form you want to use (it must be previously created using [the form builder](/tools/form)).

***

### **3. Display Options**

* **Form opened by Button**: The form will only appear when the user clicks the button.
* **Form inside Dashboard**: The form will always be visible in the dashboard view.

***

### **4. Advanced Options**

* **Filter behavior** (optional): When enabled, selected values will automatically act as filters.
* **Remove card** (optional): Hides the background and padding to integrate the form more seamlessly into the layout.

***

### **5. Button Styling**

* **Button title**: Set the text for the button (e.g., “Apply Filter”, “Search”, “Save”).
* **Button theme**: Choose a custom button color using a hexadecimal code (e.g., `#FE8533`).

***

### **6. Save**

* Click **Save** to apply your settings and activate the component.

***

#### **Tips**

* Use forms as input tools for ETL tasks, SQL queries, or REST API calls.
* Combine with dynamic dashboards to offer real-time interactivity to users.
* Customize the style to match the visual identity of your environment.


# Export CSV

<figure><img src="/files/mtLrqxvwU8WuZoWxv6YK" alt=""><figcaption></figcaption></figure>

The **Export file** task allows you to export a table from your data flow into a **CSV file**, which will be made available for download directly within the Gaio DataOS interface. It’s a practical way to share results or integrate with external systems.

***

## **How to Use**

***

### **1. Add the Task to Your Flow**

* Go to the **"Delivery"** section in the left menu.
* Drag the **Export file** task into your data flow.
* Connect it to the table you wish to export.

***

### **2. Configure the Task**

* **Task label**: A name for the task (e.g., `export_april_sales`). For internal reference only.
* **Separator**: Choose the character that will be used to separate columns in the CSV file. Gaio supports the following options:
  * `Comma ( , )`: Default for international use.
  * `Semicolon ( ; )`: Recommended for European or Brazilian formats.
  * `Tab`: Generates TSV (tab-separated values) files.
  * `Pipe ( | )`: Useful when your data contains a lot of commas or semicolons.
  * `fieldsTerminatedByTILD`: Uses the tilde `~` symbol as the field separator, useful for custom data integrations.
* **Compress file (ZIP)** *(optional)*: Enable this option if you want the resulting CSV file to be compressed as a `.zip`.

***

### **3. Save and Run**

* Click **Save** to store the task.
* Click **Run** to execute the task in your flow.
* When the flow runs, the file will be generated based on the settings.
* The download will be available with the same name as the exported table.

***

#### **Tips**

* The resulting file will include all columns and rows from the linked table.
* Use `Pipe` or `TILD` separators when your data includes a lot of punctuation.
* You can include this task in automated flows or trigger it manually as needed.


# Map

<figure><img src="/files/jW1Liu9tHK1YeaxRRKVU" alt=""><figcaption></figcaption></figure>

A prerequisite for placing a map on a dashboard is that [the map is already available ](/tools/map-editor)in Gaio, whether it is an imported map (GeoJson) or a manually created map.

Another fundamental point, is that the table containing the data to be printed on the map, needs to have a geography column in the format that the map expects. For example, the map is by State and expects the name of the State in two letters (SP, RJ, MG). So, the table that we are going to deliver to the map must have a column in this format.

{% hint style="warning" %}
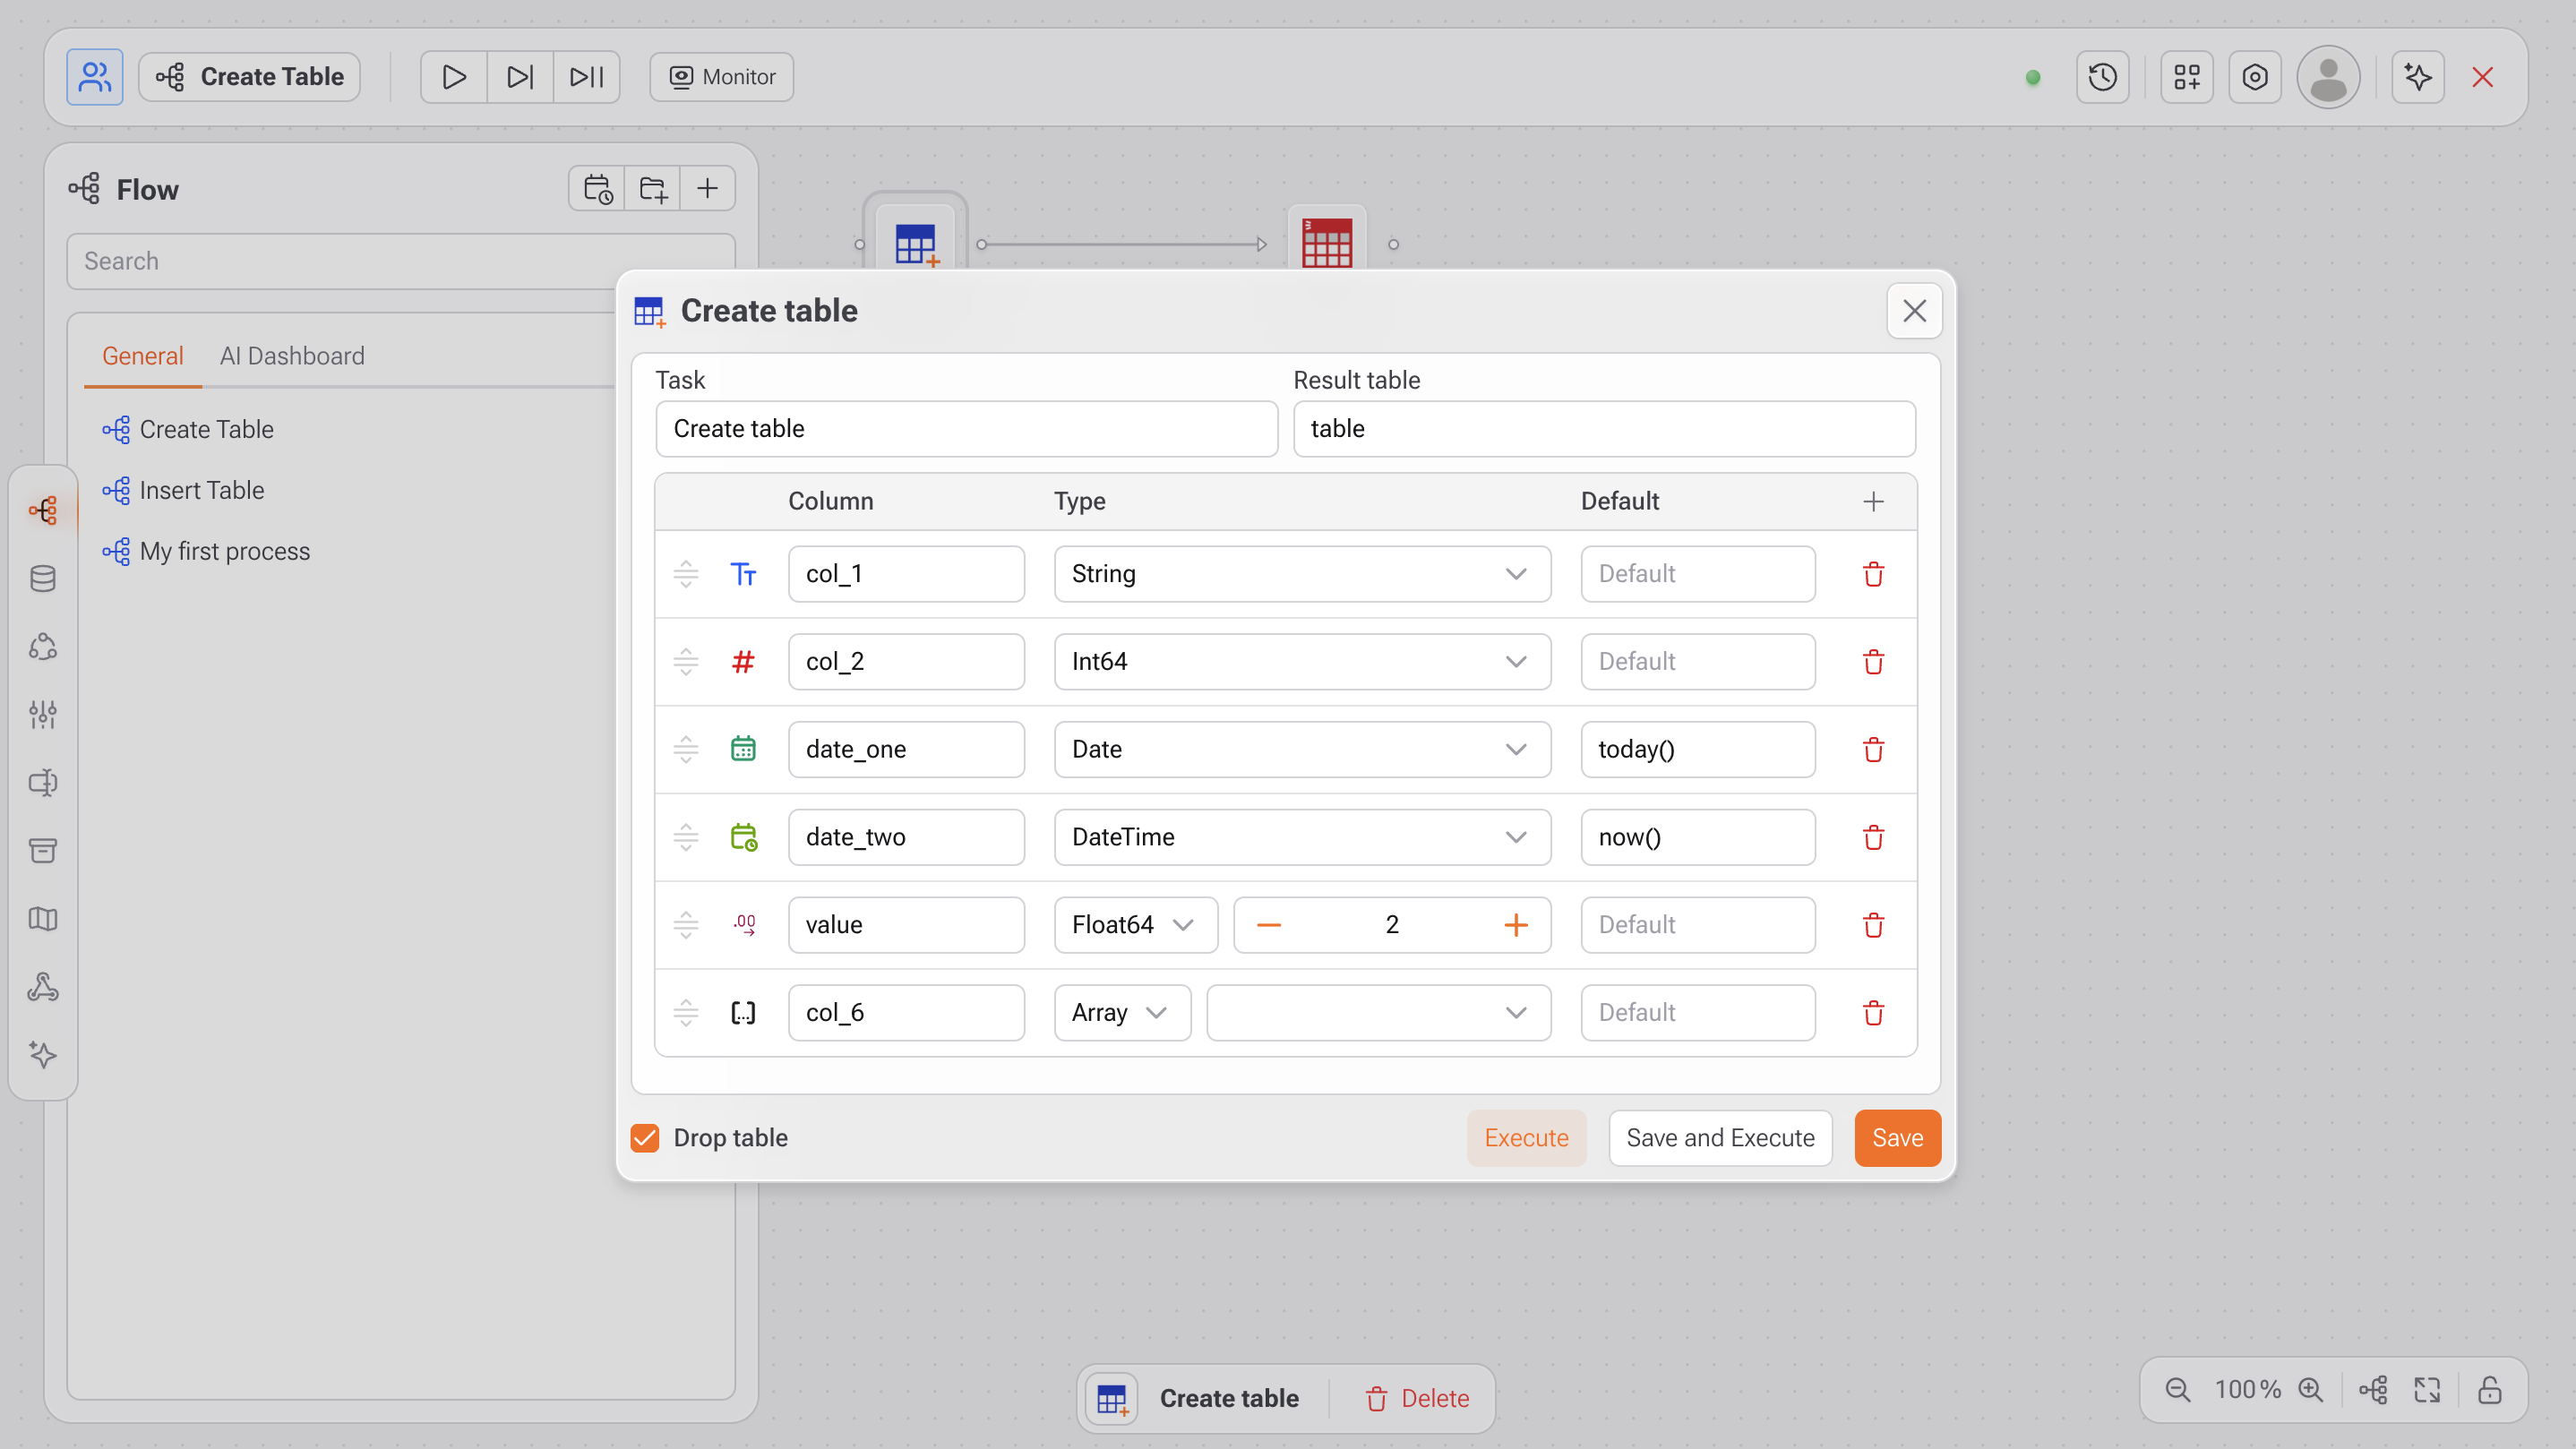
This task can only be used when a **table is selected** in the flow.️
{% endhint %}
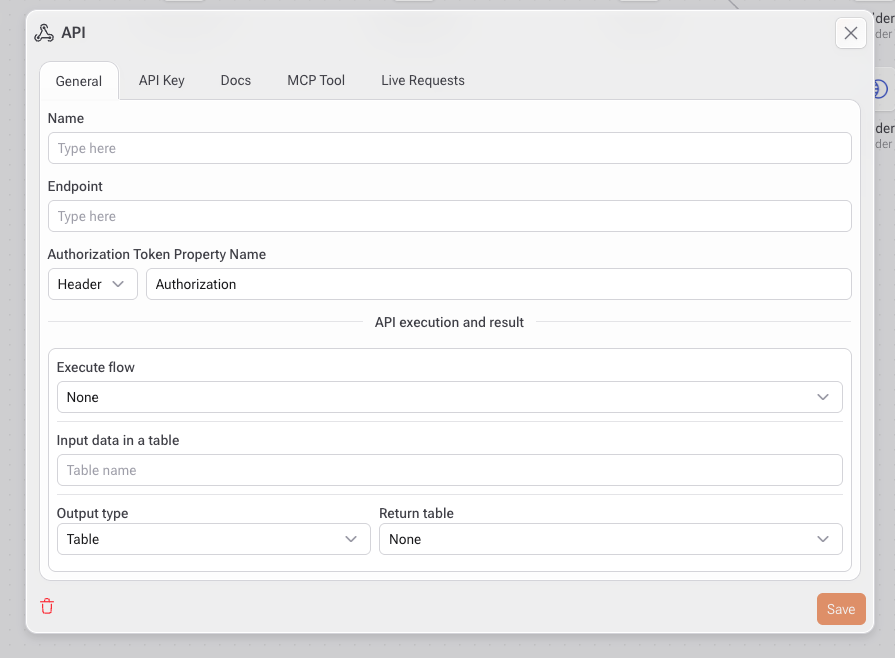
***

## **How to Use**

***

### **1. Add the Map to the Flow**

* In the **Studio**, go to the **Tasks** panel.
* Under the **Delivery** section, select **Maps**.

***

### 2. Choose the Base Map

* In the left panel, select the **Maps** option with the desired geographic area.
  * Example: `Brazil`

***

### 3. GeoJSON Options

* Set the geographic reference field used in your GeoJSON.
  * Example: `UF` (state code)

***

### 4. Link Your Data (Link table fields)

* Select the field from your dataset that matches the GeoJSON key.
  * Example: if the GeoJSON uses UF codes, select `CODESUF` from your table.

***

### 5. Choose the Data Field (Fields)

* This will be the numerical field displayed on the map.
  * Example: MARGEM\_BRUTA2

***

### 6. Select the Visualization Mode (Mode type)

* Available options:
  * Distribution: colors regions based on numerical value ranges.
  * Range: in this option the analyst defines criteria and color if the criterion is met.

***

### 7. Adjust Opacity

* Define how transparent or solid the fill colors will be on the map.

***

### 8. Set the Color Palette

* Choose up to **five colors** to represent value ranges:
  * `First color`: for lowest values (e.g., dark green)
  * `Fifth color`: for highest values (e.g., red)

***

### &#x20;Pro tips

* Use cool colors (green/blue) to indicate **positive performance** or **low risk**.
* Use warm colors (yellow/red) to show **warnings**, **high risk**, or **critical zones**.
* Combine with filters to make the map respond to selections from dashboards or forms.

{% hint style="warning" %}
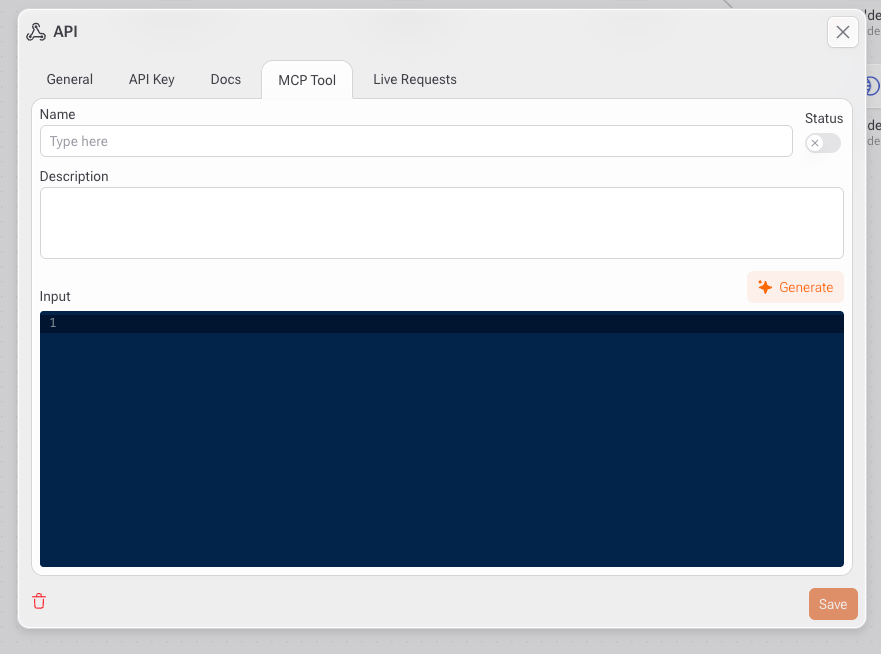
It is on this screen that the map zoom is defined. Adjust here and it will be reflected on the dashboard.
{% endhint %}

# Mail

Embedding Forms in Dashboards

<figure><img src="/files/juoIFVDg2WhnK9uDXGui" alt=""><figcaption></figcaption></figure>

The **email sending** feature in Gaio DataOS allows you to configure email service providers and automate deliveries directly from your data flows. This functionality can be used for operational communications (reports, alerts, notifications) as well as for business process integrations.

***

## &#x20;**How to Use**

***

### **1. Add the Mail to the Flow**

* Add a **Table** to your flow and choose the dataset you want to work with.
* The Report task will only become available once a table is selected.
* In the **Studio**, go to the **Tasks** panel.
* Go to **Delivery > Mail** in the task menu.

***

### **2. Message Tab**

This tab defines the message content:

* **To (email):** Select the column in the table that contains recipients' email addresses.
* **Subject:** Enter the email subject.
* **Message editor:** Create the email body using HTML, plain text, or table variables.
* **Available columns:** On the left panel, you can drag variables (such as name and email) to personalize the message.

***

### **3. Settings Tab**

This tab configures the sending provider:

* **Service provider:** Available options:
  * SMTP
  * Resend
  * AWS SES
  * SendGrid
* **Configuration fields:**
  * **Host / Port:** Address and port of the SMTP server (when applicable).
  * **User / Password:** Service authentication credentials.
  * **Sender name:** Display name of the sender.
  * **Sender email:** Sender's email address.
  * **Log Table:** Table where sending logs will be stored.
  * **Table log ID column:** Unique identifier column for logs (optional).
  * **How many days to keep logs?:** Log retention time (in days).
  * **Time in milliseconds to wait between sends:** Interval between sends (in ms).
  * **TLS and Office365/Microsoft:** Additional options for secure authentication.

***

### **4. Preview Tab**

* Allows you to preview the message before sending.
* Useful to validate personalization (e.g., user name, dynamic email).

***

### **5. Extra Data Tab**

* Space to include table additional that can be used in the email body.

***

### **6. Best Practices**

* **Logs:** Enable the log table to track sends and errors.
* **Interval between sends:** For large-volume campaigns, configure a delay to avoid provider blocking.
* **Testing:** Always test with a staging email before sending mass communications.


# Params

<figure><img src="/files/GB5DLNTtLj4EiVOPZn06" alt=""><figcaption></figcaption></figure>

The **Parameters** feature allows you to create reusable variables within your process (flow). These can be used in SQL filters, environment variables for JavaScript scripts, or to transfer values between execution blocks.

***

### &#x20;**Where to find it**

The **Parameters** tab is located in the left side panel. When you open a studio menu, you'll see the dedicated area for parameter creation and editing.

***

### **How to add a new parameter**

1. Click the **“+”** button in the upper right corner of the Parameters tab.
2. A configuration window will appear with the following fields:
   * **Param name**: Unique name of the parameter (required).
   * **Description**: Optional field to explain the purpose or usage of the parameter.
   * **Value**: Default value to be used during executions (can be changed dynamically).
3. Click **Save** to create the parameter.

{% hint style="warning" %}
When using parameters in filters within dashboards, if you want all values as default, use 'all\_'.
{% endhint %}

***

#### **How to use parameters**

Once created, parameters can be used across different blocks in your flow:

* In SQL queries: use the syntax `{{ parameter_name }}`
* In JavaScript blocks: {{`params.parameter_name}}`
* Builder: Computed: `{{ parameter_name }}`
* In dashboard visual filters: use parameters to dynamically filter your data

***

#### **Managing parameters**

* **Edit and Delete**: Click on the three dots and select option.&#x20;
* **Copy:** Click on copy.

***

#### &#x20;Notes

* The **User ID** field is a special internal parameter and can be used to identify the current user.
* Parameters are scoped to the current flow and do not affect other projects or processes.
* You can define and use multiple parameters simultaneously across your flow.


# Form

<figure><img src="/files/egjVvMcN2pW8e958uLBV" alt=""><figcaption></figcaption></figure>

Forms allow the creation of interactive interfaces for data input or dashboard filtering. They can be used to collect user information, apply filters, or trigger data flows — making them a powerful tool for systematizing analytical processes.

***

### **1. Creating a New Form**

<figure><img src="/files/U8rNczSDmMlbyonJaAGP" alt=""><figcaption></figcaption></figure>

* Go to the **Forms** tab.
* Click the **add form (+)** button.
* Set a **Title**, and optionally a **Label** to display on the user interface.
* Choose the **Execution Type**:
  * `Open flow`: Opens a new flow interface.
  * `Run flow (in background)`: Executes the selected flow without opening it.
  * `Refresh current flow`: Refreshes the existing flow after form submission.
* Select the **flow to run** (if you choose option Run flow (in background))

***

### &#x20;**2. Advanced Settings**

* **Reload current flow**: Reloads the active flow after submission.
* **Reset param after flow**: Resets the form parameters after execution.
* **Confirm before load**: Adds a confirmation step before execution.
* **Custom messages**:
  * **On Error**: Message displayed when an error occurs.
  * **On Success**: Message shown after successful execution.

***

### **3. Adding Form Fields**

<figure><img src="/files/H6gxyfwGftjCY6JMWnhW" alt=""><figcaption></figcaption></figure>

<figure><img src="/files/hkX0ZQpvZC5Urdh1B9p5" alt=""><figcaption></figcaption></figure>

* Go to the **Types** tab and drag the desired form elements:
  * Text, Number, Date, Time, Checkbox, Slider, Line divider, etc.
* Organize fields using **grid layouts** for better visual structure.
* Configure each field in the side panel:
  * Link the field to a **parameter** (e.g., `car`, `age`, `money`, etc.).
  * Adjust settings like: `Read Only`, `Required`, `All Permitted`, `Multiple`.
  * Set a **Label**, **Placeholder**, and **Field Tip** to guide the user.

***

### **4. Integration with Data Flows**

Forms can be connected directly to flows that execute SQL, Python, or AutoML steps:

* The **input parameters** from the form are passed as variables into the flow logic.
* This allows you to **dynamically filter data**, **insert records into databases**, or **trigger external APIs** based on user input.

***

#### **Best Practices**

* Use forms to let end users customize dashboards or run simulations.
* Combine field validations (required, multiple selection) to ensure data quality.
* Prefer background execution for heavy processes to keep the interface responsive.


# Files

<figure><img src="/files/T1WTyZvTYfKW8oKuKdVw" alt=""><figcaption></figcaption></figure>

The **Files** panel in Gaio DataOS allows users to upload, organize, and use local files directly within data flows. It’s ideal for working with tabular files (.csv, .xlsx, etc.) for quick analyses, algorithm testing, or even recurring data processes.

***

## What you can do:

### **1. Upload files**

<figure><img src="/files/JtutUGV5q56K08oN202K" alt=""><figcaption></figcaption></figure>

* Go to the left-side **Files** tab (folder with an upload icon).
* Click the **upload** button (cloud with an arrow icon).
* Either drag and drop your files or click **"Browse Files"** to locate them on your device.
* Supported file formats:\
  `.txt`, `.tab`, `.csv`, `.tsv`, `.xls`, `.xlsx`, `.json`, `.parquet`

(You can upload multiple files at once.)

***

### **2. Automatic organization**

Uploaded files are automatically grouped into:

* `inputs` → input files used as sources.
* `outputs` → files generated or exported from the flow.
* `content` → additional files such as text, images, etc.

***

### **3. Use files in the flow**

* After uploading, you can **drag a CSV file into the canvas**.
* This table becomes available as a data source for analysis, transformation, and dashboard building.

***

#### Quick actions for each file

Each file has action icons next to it:

* Information.
* Download file.
* Delete file.

***

#### Best practices

* Name your files clearly for easy identification.
* Use the `outputs` folder to store results of your transformations and analyses.
* Prefer `.csv` files for maximum compatibility with Gaio’s visualization and transformation features.

{% hint style="info" %}
**Large files**&#x20;

Gaio's server has no limitation on file sizes. It is worth paying attention to the fact that the server is full and no longer supports files and especially the domain manager used by the company which may impose a limit on file sizes, for example CloudFlare limits it to 200 MB .
{% endhint %}


# Map Editor

<figure><img src="/files/S5ER7WrzmLPUBeLyfK8w" alt=""><figcaption></figcaption></figure>

The **Maps** feature in Gaio allows you to create geographic visualizations directly within your data flow. It's ideal for displaying regional information, territory segmentation, delivery routes, or indicator distribution by location.

***

## How to Use the Map Editor

***

### **1.**  Access the Maps Module

* In the left-hand panel, go to **Maps**.
* to create a new map, click the plus button

***

### 2. Initial Setup (Settings Tab)

* **Title**: Enter the name of the map (e.g., Brazil, Sales Distribution).
* **Description** *(optional)*: Add context or usage notes for the map.

***

### 3. Map Visualization

* The editor uses **MapLibre** based on **OpenStreetMap**.
* You can **pan**, **zoom**, and **interact** with the map directly.
* In this environment there are two possibilities:
  1. Create a new map by drawing the polygons, line or point.
  2. Load GeoJSON, JSON maps.
* Add polygons, points, or custom areas using drawing tools.
* Useful for highlighting zones of interest, operational regions, or business-driven geographical boundaries.
* Highlighted areas represent selected regions like **states**, **cities**, or **custom zones**.

### 4. Drawings Tab

* Use drawing tools to change or delete you Highlighted areas.

### 5. Use the Top Toolbar

The top-left bar provides tools to:

* **Show Uploader**
* **Download**
* **Delete selected shape**
* **Combined shapes**
* **Separate combined shapes**
* **Public**

### 6. Save and Publish

* Click **Save** (orange button in the top-right) to store your map.
* The map can now be used in:
  * **Dashboards**
  * **Content elements** inside Gaio

***

### &#x20;Strategic Usage Tips

* Combine maps with regional datasets (e.g. sales, customer distribution, social indicators).
* Use drawing tools to define:
  * **Delivery zones**
  * **Sales territories**
  * **Risk or performance zones**
* Maps are fully responsive and ideal for both **operational dashboards** and **executive presentations**.


# API

<figure><img src="/files/4CfxJIZ4iH6C3wcZEK6I" alt=""><figcaption></figcaption></figure>

Other systems can use Gaio's analytical intelligence through APIs. This feature allows you to connect Gaio flows to external services via RESTful APIs, using secure authentication through API Keys.

***

## **How to Use**

***

### **1.** Access the API Tab

* On the left-hand panel, click the **API icon**.
* Use the **API Key** tab to create and manage your keys.
* Use the **API** tab to configure API calls to external services.

***

### 2. Create an API Key

<figure><img src="/files/ikFpcf6GcuLxIobWHz3h" alt=""><figcaption></figcaption></figure>

1. Click the **"+"** button in the upper right corner of the `API Key` tab.
2. Fill out the fields:
   * **Name**: Name of the key (e.g., `Doc`).
   * **Status**: Select `Active`.
3. Click **generate**.
4. Once the key is generated, **copy and save** it securely.
5. To view or renew the key, use the **eye** icon or the **renew** button.
6. Click **Save**.

***

### 3. Configure an API Integration

<figure><img src="/files/lOo12rx1Ntfag4zcbDAO" alt=""><figcaption></figcaption></figure>

1. Go to the **API** tab and click **"+"** to add a new integration.
2. Fill in the fields:
   * **Name**: Integration name (e.g., `SendToCRM`).
   * **Endpoint**: Only the final endpoint name (e.g., `https://api.example.com/send`).
3. **Configure authorization token:**&#x20;
   1. Choose where the authorization token will be read from.
      1. Supported locations:
         * **Header** (recommended)
         * Query parameters (if required)
4. **Select flow** (optional)**:** choose the Gaio flow to be executed when the API is called.
5. **Input data in a table** (optional): Optionally, map incoming API data into a table.
   1. When defined:
      1. Incoming request data is stored as rows
      2. The table becomes available to the executed flow
      3. Enables batch processing, auditing, and traceability
6. **Output type:** Define how the API response will be generated.
   1. **Table** → Return data from a table
   2. **Custom** → This enables a manual response body definition.

**Example Custom Response:**

```json
{
  "status": "success",
  "message": "Request processed successfully",
  "data": {
    "execution_id": "{{ params.execution_id }}"
  }
}

```

7. **Return table:** select the table that contains the data that will be consumed via API.
8. Go to the **API Key** tab and check the previously created key.
9. Click **Save**.

***

### 4. API Task · MCP Tool

<figure><img src="/files/E52FwTfwa5IrUZqJx6lE" alt=""><figcaption></figcaption></figure>

The **MCP Tool** tab allows you to expose an existing API Task as a **callable tool for AI agents**.\
Once enabled, the API can be invoked programmatically by agents during reasoning and execution. This transforms your API into a first-class AI tool, usable within chat agents, flow agents, and automated decision-making pipelines.

The MCP Tool configuration defines:

* How the API is presented to AI agents.
* What input the agent must provide.
* Whether the tool is available for execution.
* How the agent understands when and why to call it.

### How to configure MCP Tool

1. Enter a clear and action-oriented tool name.
2. Describe what the tool does and when it should be used.
3. Define the expected input schema for the tool.

```json
{
  "review_text": "string",
  "language": "string"
}

```

4. Click **Generate** to auto-create an input schema based on the API configuration.
5. Toggle the Status switch to enable or disable the tool.

***

## 5. Execution and Results

After saving the configuration:

* The API can be triggered manually or as part of an automated process in Gaio.
* If a process is selected, it is executed whenever a Gaio API endpoint is called. This means that any analysis can be performed through calls external to Gaio, such as creating/applying a predictive model, inserting, deleting, calling external APIs (REST), accessing data sources external to Gaio, and all other features.
* **Row limit** : It is possible to limit the number of rows to be returned by the Gaio API, even if the generated table has millions of rows.

```
https://your_url/endpoint?limit=10
```

* Use limit and offset parameters to implement pagination and navigate through large datasets.

{% code overflow="wrap" %}

```
https://your_url/endpoint?limit=10&offset=10
```

{% endcode %}

* Retrieve data in pages using the limit and page parameters for better user experience with large datasets.

```
https://your_url/endpoint?limit=10&page=1
```

* Add custom parameters to filter and customize API responses based on specific criteria. If the query that precedes the API task filters the table with this parameter, only the requested data will be sent in the API result. Example: enter the client code in the API call and Gaio will return the products to offer for that specific client.

{% code overflow="wrap" %}

```
https://your_url/endpoint?limit=10&page=1&param_name_one=sales&param_name_two=male
```

{% endcode %}

{% hint style="warning" %}
&#x20;For each Gaio API, a unique access key is generated, which in the image above was masked.
{% endhint %}

### API Task · Live Requests

<figure><img src="/files/rMOP4TlIdI3VRLTmgZK3" alt=""><figcaption></figcaption></figure>

The **Live Requests** tab allows you to **monitor API calls in real time** after the API Task is executed.\
It provides visibility into incoming requests, execution behavior, and runtime data, making it an essential tool for debugging and observability.

#### What You Can See

After the API is called, each request appears in the Live Requests panel with:

* Incoming request data
* Parameters and payload
* Execution context
* Response or execution result
* Errors (when applicable)

This information is displayed **in real time**, without requiring redeployment or restarts.

#### Typical Use Cases

* Debugging authentication issues
* Validating request payloads
* Monitoring flow execution behavior
* Verifying custom output responses
* Observing agent-triggered API calls
* Troubleshooting external integrations

***

#### Best Practices

* **Security**: Never share your API Key. Use the `Inactive` status to temporarily disable access.
* **Versioning**: Create new entries for APIs with structural changes.
* **Validation**: Test endpoints manually before embedding in automation flows.


# Discovery

<figure><img src="/files/c3MKEJAhPxqDLQGFli6O" alt=""><figcaption></figcaption></figure>

Gaio's Discovery feature allows you to automatically configure and explore table columns to uncover insights, AI-powered dashboards, and advanced search via PowerSearch.


# Power Search

<figure><img src="/files/kp7zUI6ZDrH4ZNPeHQ3U" alt=""><figcaption></figcaption></figure>

Gaio Power Search is a remarkable feature that significantly simplifies the availability of data for all employees in a company. With high ease of creation and use, users can access this functionality from the Gaio Platform’s home screen and naturally type in the terms they wish to search. Gaio will automatically create data visualizations with charts that best demonstrate the results of the query, making information exploration a quick and efficient task.

***

## **How to Use**

***

### **1. Access the Power Search task**

* In the **Studio**, go to the Delivery panel.
* Click on plus button.

***

### **2. Configure Basic Info**

* **Label**: Add a name for the task to identify it context.
* **Table Name:** choose the table that will serve as your data source (e.g., `sales`).
* **Description** *(optional)*: helpful text to clarify the meaning of the table.
* **User filter column** *(optional)***:** field to apply automatic filters based on the logged-in user (e.g., `region` or `sales_rep`).
* **Search**: search columns of your table.

***

### **3.Configure the Fields**

For each column in the table, you can configure:

* **Field Type** (icon on the left):
  * `Value`: for categorical or text fields
  * `Sum`: for numeric fields to be aggregated (e.g., units sold)
  * `Month`: for time-based fields used in timelines
* **Title**: label displayed in generated visualizations
* **Description** *(optional)*: helpful text to clarify the meaning of the field
* **Format**: choose formatting such as Decimal, Currency, Percentage, etc.

***

### **4. Save the Configuration**

* Click **Save** in the top-right corner to apply your settings.

### **5. Activate PowerSearch**

* After saving, leave the studio and click the **Search** button to enable the AI-powered search interface or click in Ctrl+G.

***

#### &#x20;Best Practices

* Use **friendly and descriptive names** for fields (e.g., “Order Date” instead of “order\_dt”)
* Always add **descriptions** to help users understand each field
* Format numeric fields clearly — such as setting them as Decimal or Currency
* **Remove unnecessary fields** to simplify and optimize search results
* Focus on **aggregatable fields** (like units\_sold, revenue, etc.) for richer insights


# Insights

<figure><img src="/files/mPNpjWHqGt7Iy5rPDSow" alt=""><figcaption></figcaption></figure>

The **Insights** task in the Discovery module is designed to help users find trends of growth, decline and abrupt changes in your indicators . It is organized into three subtabs: **General**, **Advanced**, and **Schedule**.

***

## **How to Use**

***

### **1. Access the Insights task**

* In the **Studio**, go to the Delivery panel.
* Click on plus button.
* Click on insights botton.
* Go to insights tab.

***

### **2. Configure the** General Tab

Use this tab to define the analytical structure that will guide the automatic insights engine:

* **Dimensions**: Select the categorical variables (e.g., Region, City) to break down the analysis.
* **Measure Type**: Choose how the metrics will be evaluated. Options include:
  * *Field*: direct field analysis
  * *Cumputed*: custom metric logic
* **Measures**: Choose the numeric fields to analyze (e.g., sales, profit).
* **Dates**: Select the date field to enable time-based analysis.

{% hint style="warning" %}
**Tip**: Always prioritize dimension hierarchy (e.g., Country → State → City) to improve the granularity of the insights.
{% endhint %}

***

### **3.Configure the Advanced Tab**

Customize the insight generation formatting:

* **Default Period**: Choose the default time granularity for trends (e.g., Dayly, Weekly, Monthly).
* **Growth Percentage (%)**: Set a growth threshold to highlight significant changes.
* **Percent/Decimal Size**: Define how many decimal places to display for percentage and numeric metrics.
* **Separator**: Choose between `dotComma` or `commaDot` for number formatting (e.g., 1,000.00 vs 1.000,00).
* **Invert Colors**: Enable this to flip the color scheme, useful for emphasizing negative trends.

***

### **4. Configure the** Schedule Tab

Use this section to automate the refresh of your insights periodically:

* **Every**: Define the frequency (e.g., Minute, Hour, Day, week, month, Year).
* **Time Options**:
  * *Of the month*: Choose specific days of the month.
  * *On the day / weekday*: Define specific calendar days or weekdays.
  * *At hour / minute*: Set precise execution times.
* **Status**: Toggle the task as *Active* to enable scheduling.

{% hint style="warning" %}
**Note**: Changes will only apply to future runs. Ongoing jobs will not be interrupted.
{% endhint %}

***

### **5. Save the Configuration**

* Click **Save** in the top-right corner to apply your settings.

***

### **6. Use Insigths**

* After saving, leave the studio and click the **Insights** button to view interface or click in Ctrl+I.

***

#### Best Practices

* **Choose meaningful dimensions:** Avoid using too many dimensions at once—stay focused to avoid diluting the results. Use intuitive names to make insights easier to interpret.
* **Use relevant metrics:** Select numeric fields such as `sales`, `quantity`, or `profit`. Avoid metrics with many null values.
* **Always include a date field:** Date fields allow time-based analysis (e.g., monthly growth). Use fields like `sale_date` or `created_at`.
* **Set a default period:** In the *Default Period* field, choose a time frame like Monthly or Weekly to guide the analysis.
* **Use the growth threshold wisely:** Define a minimum percentage (%) to highlight only significant changes and ignore small fluctuations.
* **Avoid incomplete fields:** Make sure selected fields have clean and consistent data.
* **Schedule when appropriate:** Use the *Schedule* tab to automate insights generation (e.g., every Monday at 8 AM).
* **Add descriptions to fields:** Makes it easier for other users to understand and improves data governance.


# AI Chat

<figure><img src="/files/SrhWQWZLfs8OBOvGql0A" alt=""><figcaption></figcaption></figure>

This feature allows you to create intelligent dashboards using Gaio’s AI Assistant. There are two main flows to activate and use this capability:

***

### **Flow 1 — Enabling from Studio (Discovery)**

<figure><img src="/files/bSpsi9yKzmSLDxNOVrlH" alt=""><figcaption></figcaption></figure>

1. **Access the Studio**
   * On the left sidebar, click the **Discovery** icon  to open the Discovery section.
2. **Create or edit a context table**
   * Click the **"+"** button to add a new Discovery or select an existing one.
   * Fill in the required fields such as the table name and define available columns (e.g., value, sum, format).
3. **Enable AI Dashboard**
   * On the top right corner, click the **AI Dashboard** button to activate this context for AI usage.
4. **Go to the Projects screen**
   * On the bottom menu, click the **orange AI button**.
5. **Create a Smart Dashboard**
   * A window will open with available smart dashboards.
   * Click **+ New** to create a new one.
   * Once inside, click **"Be smart, build a dashboard"** and the AI Assistant will generate your visualizations.

***

### **Flow 2 — Quick Upload + AI Context Activation**

1. **Open Quick Upload**
   * From the Projects screen, click the **Quick Upload** button (cloud icon with arrow).
2. **Upload your file**
   * Upload a CSV, Excel, or other supported file.
   * Name your table and assign it to a selected project.
3. **Enable for AI Use**
   * Before uploading, check the option **Table Discovery**. This makes the table available for Power Search and AI features.
4. **Continue from Step 3 of Flow 1**
   * Click the AI button in the Projects screen.
   * Create a new AI Dashboard.
   * Use the AI Assistant to automatically generate dashboard views based on the uploaded data.

{% hint style="info" %}
To configure a chat agent, check this [section](https://docs.gaiodataos.com/~/revisions/gfwLesSVMDZADVyxkMM3/tools/agents).
{% endhint %}


# Agents

<figure><img src="/files/6QlzNB3NxAWg8gKJU1sq" alt=""><figcaption></figcaption></figure>

The **Agents** feature is the core area for creating and managing artificial intelligence capabilities within the system. It allows you to build **chat agents**, **RAG structures (Retrieval-Augmented Generation)**, and **tools** that extend what agents can know and do.The main goal of this section is to help you **design agent behavior, knowledge, and actions** in a structured, reusable, and scalable way.

When you access **Agents**, you will see:

* A **left sidebar** listing all created agents
* A **search field** to quickly locate agents
* Top tabs to switch between:
  * **Agents**
  * **Tools**
  * **RAG**
* A **( + ) button** to create new resources

<figure><img src="/files/0ZyeVOOzpBxzrtXQbXkF" alt=""><figcaption></figcaption></figure>

## How to configure your Agent

1. **Accessing the Agents Area**

   1. In the left navigation menu, click the Agents icon;
   2. You will be taken to the agent creation and management screen.

   This screen works as a **central control panel**, where you can:

   * Create new agents
   * Edit existing agents
   * Manage tools and knowledge bases
   * Define how each agent behaves inside the system
2. **Creating a new resource**
   1. Click the (+) button at the top of the screen
   2. Select one of the available options:
      1. New chat agent: Create a conversational agent with defined personality, goals, and rules
      2. New RAG: Create a contextual knowledge base for retrieval
      3. New tool: Create a tool that performs actions or integrations

### How to create a New RAG (Retrieval-Augmented Generation)

First of all, a **RAG** is a knowledge layer that allows agents to **retrieve information from documents and files** and use that content to generate more accurate, contextual, and reliable responses. Instead of relying only on the model’s general knowledge, RAG enables the agent to **ground its answers in your own data**.

Basically, RAG is designed to:

1. Provide **fact-based answers** using internal documents;
2. Reduce hallucinations by grounding responses in real content;
3. Enable agents to work with:
   * CSV files
   * Text documents (PDF, .doc, .txt, .md, .pptx, etc)
   * Structured and semi-structured data (.json, .png, .jpg, .mp3, .mp4, etc)

{% hint style="info" %}
A RAG does not act on its own. It must be **attached to a Chat Agent** to be used during conversations.
{% endhint %}

The RAG configuration screen is divided into two main areas:

* **Left panel** → RAG definition and behavior
* **Right panel** → File selection and management

<figure><img src="/files/nESz7WMIR3mV6wbSrD5c" alt=""><figcaption></figcaption></figure>

After opening the panel, it is recommended to enter a clear and descriptive name for the RAG that reflects the dataset or domain, describes the type of information provided, and defines when the agent should consult this file.\
On the Files section, you can:

1. Use the search field to filter files by name.
2. Select one or more files from the list.

Once selected, the content of these files becomes searchable by the agent.

{% hint style="info" %}
To import files, see the [Files Ingest](https://docs.gaiodataos.com/~/revisions/ihb6ExonxKYgDpEYd1Cr/tools/tasks/etl/files-ingest) section in this document.&#x20;
{% endhint %}

### How to configure new tools

**Tools** define **what actions an agent can perform** beyond conversation. They extend an agent’s capabilities by enabling integrations, secure data access, controlled queries, and media handling. An agent can only use tools that are **explicitly created and assigned to them**. This ensures safety, predictability, and governance.

<figure><img src="/files/uGT1A5twMZV29wC2F1mw" alt=""><figcaption></figcaption></figure>

On the **Tools** screen, you can create and manage the following tool types:

| Tool             | Purpose                                 |
| ---------------- | --------------------------------------- |
| HTTP Request     | Call external APIs and services         |
| MCP              | Connect to MCP-based APIs and services  |
| Verified Queries | Execute pre-approved SQL queries safely |
| Media File       | Selected and retrieve media assets      |

Each tool type is designed for a specific class of action and has its own configuration model.

1. **Creating a new tool:**
   1. Open the **Tools** section
   2. Click on the desired tool type card
   3. Configure the tool parameters
   4. Click **Save** to persist the tool

#### HTTP Request

The **HTTP Request** tool allows an agent to interact with **external APIs** using standard HTTP methods.

<figure><img src="/files/GGVHeM3LgxH50QYZlvzb" alt=""><figcaption></figcaption></figure>

**Typical use cases:**

* Fetch data from third-party services
* Send data to external systems
* Trigger workflows or webhooks

**Key characteristics:**

* Supports Rest-based APIs
* Parameters are explicitly defined
* An agent can only call configured endpoints

#### MCP

The MCP tools enable integration with MCP-compliant APIs.

<figure><img src="/files/VE39w9Z5GZHVrjG1f3m6" alt=""><figcaption></figcaption></figure>

**Typical use cases:**

* Access internal or partner services exposed via MCP
* Standardized API interactions
* Controlled access to enterprise systems

**Key characteristics:**

* Strongly structured API access
* Designed for enterprise-grade integrations
* Reusable across multiple agents

#### Verified Queries

The **Verified Queries** tool allows agents to run **pre-approved SQL queries** safely.

<figure><img src="/files/w3bbsJCjGIE6aPufG2iY" alt=""><figcaption></figcaption></figure>

**Purpose:**

* Prevent arbitrary query execution
* Enforce data governance
* Guarantee performance and security

**How it works:**

1. Queries are defined and validated in advance
2. Only these queries can be executed by agents
3. Agents can pass parameters, but not alter logic

**Important:**\
Agents cannot write or modify SQL. They can only execute **verified queries**.

#### Media Files

The **Media File** tool allows an agent to **access, reference, and optionally deliver files** during a conversation. It is commonly used when an agent needs to **share documents, images, or other assets** as part of its response. This tool is ideal for **support materials, reports, visual assets, and downloadable content**.

<figure><img src="/files/C2q1oIL69lzSFLS0e7OA" alt=""><figcaption></figcaption></figure>

Use the Media File tool when you want an agent to:

* Provide files as part of an answer
* Reference official documents or media assets
* Deliver controlled downloads to users
* Enrich responses with visual or supporting material

#### How to create your Agent

Once **Tools** and **RAGs** have been created, the developer can assemble a **Chat Agent**. This step defines **who the agent is**, **how it behaves**, and **what it is allowed to access**.

A Chat Agent acts as the **orchestration layer**, combining:

* Identity and intent
* Behavioral rules
* Knowledge sources (RAG or table data)
* Diagrams (data across tables relationships)
* Action capabilities (Tools)

<figure><img src="/files/S1nasNFYzX6766NwiZZP" alt=""><figcaption></figcaption></figure>

All agent-level configurations are defined in the General tab, where you can:

* Provide a clear and meaningful name for the agent.
* Write a short description explaining what the agent does.
* Define the agent's identity, tone, capabilities, and boundaries.
* Describe the agent's primary objective and success criteria.
* Provide context, constraints, and domain background.
* Provide example questions to guide the end user.

After defining the agent’s identity, the developer configures **what the agent can access**.

{% @arcade/embed flowId="XZMXCSkFswdfAiYiYxkG" url="<https://app.arcade.software/share/XZMXCSkFswdfAiYiYxkG>" %}

{% hint style="info" %}
For discovery settings, please access this [section](https://docs.gaiodataos.com/~/revisions/tXsIwAk6feCVad8u6hWf/tools/discovery).
{% endhint %}

{% hint style="info" %}
For Schema creation, please access this [section](https://docs.gaiodataos.com/~/revisions/g8M3e4iVxLZxX71niGCJ/tools/diagram-schema).
{% endhint %}


# AI Helper

<figure><img src="/files/NKbhlRisk5r6pczJuVBJ" alt=""><figcaption></figcaption></figure>

The **AI Helper** is a contextual assistant integrated into the platform’s query, script, and data transformation workflows. It allows users to request help directly within the working environment, without switching to external tools.

The assistant is accessed through the **AI Helper** button, available in the top bar of supported screens. When opened, it displays a side panel on the right side of the interface while keeping the editor, builder, or configuration area visible.

### Where AI Helper is available

AI Helper is available in the main development and data modeling environments of the platform:

| Area                              | Description                                                                                                             |
| --------------------------------- | ----------------------------------------------------------------------------------------------------------------------- |
| **SQL**                           | Available in the SQL editor to help create, explain, fix, and optimize queries.                                         |
| **Python**                        | Available in the Python script editor to explain code, investigate execution errors, and suggest improvements.          |
| **Builder**                       | Available in the visual query builder, helping users work with columns, filters, joins, groupings, sorting, and limits. |
| **Computed Field within Builder** | Available when creating or editing computed fields, helping users write, fix, and explain expressions.                  |
| **Source SQL**                    | Available when defining SQL sources, helping users create, validate, and understand the query used as the data source.  |

### Purpose

The AI Helper is designed to support users throughout the development workflow by helping them:

* Understand what a query, script, or configuration does;
* Improve or optimize SQL queries;
* Explain Python code;
* Investigate execution errors;
* Interpret unexpected results;
* Suggest next steps;
* Create computed fields;
* Build visual queries in the Builder;
* Explain expressions, functions, and transformations;
* Adjust logic, filters, joins, aggregations, sorting, and limits.

### Accessing AI Helper

To open the assistant:

1. Go to a supported screen, such as **SQL**, **Python**, **Builder**, **Computed Field**, or **Source SQL**.
2. Click the **AI Helper** button in the top bar.
3. The assistant panel will open on the right side of the interface.
4. Type a question or select one of the available **Quick Prompts**.

The panel can be closed using the **X** icon in the upper-right corner.

### Contextual behavior

AI Helper detects the active context and adapts its assistance according to the area currently in use.

Examples:

```
Active tab: code
```

```
Active tab: builder
```

```
Active tab: computed
```

This indicator shows which area the assistant is using as context. Based on that context, questions and suggestions can be directed to the active SQL code, Python script, Builder configuration, or computed field expression.

### Usage in SQL

In the [SQL editor,](https://docs.gaiodataos.com/~/revisions/bYcp6p0pV7NhCwqVJU6A/tools/tasks/etl/sql) AI Helper can be used to:

* Explain the purpose of a query;
* Review the query structure;
* Identify possible syntax errors;
* Suggest performance improvements;
* Adjust filters, joins, groupings, and sorting;
* Investigate incorrect or unexpected results.

Example questions:

```
What does this query do?
```

```
How can I improve this query?
```

```
Why is this query returning an error?
```

```
Is there any issue with this join?
```

### Usage in Python

In the [Python](https://docs.gaiodataos.com/~/revisions/bYcp6p0pV7NhCwqVJU6A/tools/tasks/analytics/python) script editor, AI Helper can assist with code analysis and maintenance.

It can be used to:

* Explain how a script works;
* Identify execution errors;
* Suggest simplifications;
* Organize or refactor code;
* Detect possible logic issues;
* Support the use of libraries, functions, and data manipulation.

Example questions:

```
What does this script do?
```

```
Why is this code failing?
```

```
How can I organize or simplify this script?
```

```
Is there a more efficient way to write this code?
```

### Usage in Builder

In the [**Builder** ](https://docs.gaiodataos.com/~/revisions/bYcp6p0pV7NhCwqVJU6A/tools/tasks/etl/builder)interface, AI Helper supports visual query creation. It helps users understand the relationship between visual configurations and the generated SQL.

The assistant can be used to:

* Explain the SQL generated by the Builder;
* Provide guidance on when to use filters;
* Support join configuration;
* Suggest groupings;
* Explain sorting;
* Provide guidance on row limits and pagination;
* Explain the difference between using the visual Builder and writing SQL directly.

Example questions:

```
What does the generated SQL mean?
```

```
How do I add a filter to this query?
```

```
When should I use a join in Builder?
```

```
What is the difference between Builder and Query task?
```

### Usage in Computed Field within Builder

When creating or editing a **Computed Field** within Builder, AI Helper is available to help write the expression.

This context is useful for:

* Creating calculated expressions;
* Fixing invalid expressions;
* Explaining existing expressions;
* Suggesting compatible functions;
* Supporting the use of ClickHouse functions;
* Validating expected data types;
* Transforming values from existing columns.

Example questions:

```
Create an expression for this calculated field.
```

```
Fix this expression.
```

```
Explain this expression.
```

```
Which ClickHouse function can I use here?
```

### Usage in Source SQL

In the [**Source SQL**](https://docs.gaiodataos.com/~/revisions/bYcp6p0pV7NhCwqVJU6A/tools/tasks/etl/source-sql) context, AI Helper assists with creating and maintaining the SQL query used as the data source.

It can be used to:

* Explain the source query;
* Validate the SQL structure;
* Suggest improvements;
* Identify syntax issues;
* Adjust selected columns;
* Review filters applied at the source level;
* Prepare data before it is used in later steps.

Example questions:

```
Is this query suitable as a data source?
```

```
Explain this Source SQL.
```

```
How can I improve the source query?
```

```
Is there any incorrect filter in this Source SQL?
```

### Quick Prompts

AI Helper provides shortcuts with frequently used questions based on the active context.

Examples of prompts by context:

| Context            | Quick Prompt examples                                                               |
| ------------------ | ----------------------------------------------------------------------------------- |
| **SQL**            | `What does this query do?`, `How can I improve this query?`, `Error or odd result?` |
| **Python**         | `What does this script do?`, `Execution error`, `Organize or simplify`              |
| **Builder**        | `What does generated SQL mean?`, `Builder vs Query task`, `Where to work?`          |
| **Computed Field** | `Create expression`, `Fix expression`, `ClickHouse function`, `Explain expression`  |
| **Source SQL**     | Prompts related to explaining, validating, and improving the source query.          |

### Interface structure

| Element              | Description                                                                                        |
| -------------------- | -------------------------------------------------------------------------------------------------- |
| **AI Helper button** | Opens the assistant side panel.                                                                    |
| **Side panel**       | Area where the user interacts with the assistant.                                                  |
| **Active tab**       | Indicates the currently active tab or context, such as `code`, `builder`, or `computed`.           |
| **Guidance area**    | Displays a message informing the user that they can ask about code, errors, output, or next steps. |
| **Quick Prompts**    | Quick suggestions for common questions, adapted to the active context.                             |
| **Message field**    | Field where the user types their request.                                                          |
| **Send button**      | Sends the message to the assistant.                                                                |
| **X icon**           | Closes the AI Helper panel.                                                                        |

### Recommended workflow

1. Open a supported area: **SQL**, **Python**, **Builder**, **Computed Field**, or **Source SQL**.
2. Create or edit the query, script, configuration, or expression.
3. Open **AI Helper**.
4. Check the context shown in **Active tab**.
5. Use a **Quick Prompt** or type a specific question.
6. Review the assistant’s response.
7. Apply the necessary adjustments.
8. Execute, save, or validate the result again.

### Best practices

For more accurate responses, it is recommended to:

* Ask clear and specific questions;
* Describe the expected behavior;
* Mention whether the issue is related to an error, performance, logic, or incorrect result;
* Review the response before applying changes;
* Manually validate any suggestion using real data;
* Run tests after changing queries, scripts, or expressions.

{% hint style="info" %}
AI Helper acts as a support layer for development in SQL, Python, and Builder. It is also available in specific contexts such as **Computed Field within Builder** and **Source SQL**.
{% endhint %}

{% hint style="warning" %}
Suggestions provided by the assistant should be reviewed by the user before being saved, executed, or used in production environments.
{% endhint %}


# Export and Import Projects

<figure><img src="/files/VWv94tp6hvVGX1AbLKLL" alt=""><figcaption></figcaption></figure>

## **Project Overview Panel**

At the top-left of the screen, you'll find a panel showing your current project (e.g., `Proj: Gaio Doc`) along with key metadata:

* Application ID (`app:31`)
* Data bucket name (`bucket_31`)
* Number of flows, dashboards, forms, and other technical components

This panel also includes the main actions to **export and import** your project.

***

## **How to Export an Application**

<figure><img src="/files/5tL3mRq0ZqgOxKd7hgDO" alt="" width="375"><figcaption></figcaption></figure>

You can export your current application — including flows, parameters, forms, APIs, AI dashboards, and tables — into a single **`.zip` file containing multiple `.json` files**. This is ideal for:

* Creating backups
* Sharing with teammates
* Migrating between environments (e.g., dev → prod)
* Reusing the structure in new applications

### &#x20;Step-by-step:

1. Click the **Export** button in the bottom section of the project panel.
2. A new window will open with tabs such as:
   * `Flow`: SQL and visual flows
   * `Params`: parameters used across the app
   * `Forms`: custom user input forms
   * `Discovery`: AI-enabled searches, insights, and tables
   * `API`, `Maps`, and more
3. Select the items you wish to include by ticking their checkboxes.
4. Click the **Export** button in the top-right corner.
5. A `.zip` file will be generated containing your app's structure and logic.

***

### View Exported Files

<figure><img src="/files/xlLICKVES9rw1au3rtyQ" alt="" width="375"><figcaption></figcaption></figure>

After exporting, go to the **Files** panel (folder icon in the sidebar). Your uploaded `.zip` file will appear under the `backups` folder. From there, you can:

* View the file
* Download it
* Delete it

***

## **How to Import an Application**

<figure><img src="/files/wcOlPPDURW664XYtPi7g" alt="" width="375"><figcaption></figcaption></figure>

Importing allows you to fully or partially restore a project from a previously exported `.zip` file.

### Step-by-step:

1. Click the **Import** button in the project panel.
2. A new screen will prompt you to upload your `.zip` file:
   * Drag and drop the file
   * Or click **“Browse Files”** to select it
3. Click **Import**.
4. Gaio will process the contents and restore:
   * Flows
   * Parameters
   * Forms
   * Discovery insights and AI-related items
   * APIs and additional elements

***

### Best Practices

* Always export a backup before making critical changes
* Use the import/export feature to replicate applications across buckets or environments


# General

<figure><img src="/files/albXKXqKpqZkcAIkiCp2" alt=""><figcaption></figcaption></figure>

The **Settings** area is the central place to manage **account configuration, access control, integrations, and platform behavior** in Gaio DataOS. It is designed for **administrators** who need to configure the environment, manage users, and control how the platform operates.

The Settings section allows you to:

* View account and license information
* Configure authentication and access
* Manage users and data sources
* Control AI and MCP-related settings
* Enable white-label and sharing features *(specific to Enterprise license)*

At the top of the Settings screen, you will find the main tabs:

* General
* Tags
* Users
* Sources
* AI
* MCP API Keys
* Project Share

### General

The **General** section displays **account-level information** and global configuration options.

#### Gaio Account

This panel shows the current account details:

* **License** – Active license associated with the account
* **Version** – Installed Gaio DataOS version
* **Type** – Account or deployment type
* **GPS Help Desk** – Support status
* **User Limit** – Maximum number of users allowed

These fields are informational and help administrators understand the current environment and limitations.


# White Label

<figure><img src="/files/6LqcSdElr2vK8HsLaCM5" alt=""><figcaption></figcaption></figure>

The **White Label** section allows you to fully customize the **visual identity and initial experience** of Gaio DataOS, enabling the platform to reflect your brand or your client’s brand. This feature is intended for **enterprise customer.**

### Purpose of White Label

White Label configuration enables you to:

* Apply your own **branding and visual identity**
* Customize the **login experience**
* Control initial onboarding behavior
* Deliver Gaio DataOS as a **branded platform**

## How to configure White Label

1. Toggle: Turn on/off White Label
2. Edit your initial theme preferences
3. Set the default system language
4. Enable to show the quick start screen when users access the system.
5. Enable to use a custom background image on the login screen
6. Disable the background rotation animation
7. Upload used on the login screen
8. Displayed in browser tabs and bookmarks
9. Displayed in the platform’s power search interface

### Best Practices&#x20;

* Enable White Label only after all assets are prepared.
* Use consistent colors across theme and images.
* Prefer static backgrounds for professional deployments.
* Test the login screen on different screen sizes.
* Keep favicon simple and readable at small sizes.


# Authentication Providers

<figure><img src="/files/E7Dg5dQdfAaUubqVrG43" alt=""><figcaption></figcaption></figure>

The **Authentication Providers** section allows you to configure **how users authenticate** in Gaio DataOS, combining traditional authentication, enhanced security, and third-party identity providers (SSO). These settings are **project-wide** and directly impact security, access governance, and user experience.

In this section, you can:

* Define global authentication policies.
* Enable or disable **Two-Factor Authentication (2FA).**
* Configure session timeout.
* Allow or restrict email/password login.
* Integrate **third-party authentication providers (SSO).**

### Authentication Settings

* Two-factor authenticator (Google Authenticator, Microsoft Authenticator, Authy, etc.)
  * Adds an extra security layer to user login
  * Based on time-based authenticator apps
  * Strongly recommended for:
    * Corporate environments
    * Sensitive data projects
    * Multi-user workspaces
* Session timeout (zero for infinite): Defines the maximum duration of an active session.
* Activate third party providers
  * Enables external authentication providers
  * Uses OAuth / identity federation standards

### Authentication Flow

User opens the login page\
→ Selects an available authentication method.\
→ (Optional) Completes 2FA validation.\
→ Session starts based on the configured timeout.

## Step-by-Step Guide to Obtain Google Credentials

### How to Create a Google Account to Use as an Authentication Provider

1. Access Google Cloud Console
   1. Log in to the Google Cloud Console using the link: <https://console.cloud.google.com/>
2. Create a New Project
   1. Click on **“Select a project”.**
   2. A popup will open — click **“New Project”.**
   3. You will be redirected to the project creation page.
   4. Fill in:
      * **Project name**
      * **Organization location** (if applicable)
   5. Click **“Create”**
3. Google Cloud Free Trial (Optional)
   1. After creating the project, you may be redirected to the **“Start your free Google Cloud trial”** screen.
      1. You can agree and continue
      2. Choose whether the account will be:
         * Organizational
         * Personal
4. Access Google Auth Platform
   1. Once your account is ready, go to: <https://console.cloud.google.com/products>
      1. In the **“All products”** list, find and click **“Google Auth Platform”**
      2. On the main screen, under the **“Overview”** tab, click **“Get started”**
      3. Fill out the form and create a new configuration
5. Create OAuth Client
   1. After completing the setup, you will see a screen with:
      1. **Metrics**
      2. **Project Check-up**
         * In this screen, under **Metrics**, click **“Create an OAuth client”.**
6. Configure OAuth Client
   1. Set **Application type** to **Web application**
   2. Define the **Application name**
   3. Configure the following fields (you will need help from your developers):
      * **Authorized JavaScript origins**
      * **Authorized redirect URIs**
   4. Click **“Create”**
7. Retrieve Client ID and Client Secret
   1. A popup will appear showing the **Client ID.** Click **OK.**
   2. &#x20;Navigate to: <https://console.cloud.google.com/auth/clients>
   3. Select the client you just created
   4. In the bottom-right corner, click **“+ Add secret”** (if one does not already exist)
   5. Create a new secret
   6. Copy and store securely:
      * **Client ID**
      * **Client Secret**

{% hint style="info" %}
These credentials will be used to configure Google as an authentication provider in your application (OAuth 2.0).
{% endhint %}

{% hint style="danger" %}
**Keep the Client Secret secure and never expose it in public repositories.**
{% endhint %}

## Microsoft Entra ID (Azure AD) — Step-by-step to get OAuth credentials (Client ID + Client Secret)

#### What you will obtain

* **Tenant ID** (Directory ID)
* **Client ID** (Application ID)
* **Client Secret** (Secret Value)
* **Redirect URI(s)** (Callback URL(s)) configured for your app

These are the typical values required to configure Microsoft as an authentication provider.

1. Access the Microsoft Entra admin center
   1. Open the Microsoft Entra admin center (Entra portal).
   2. Sign in with an account that can create app registrations (typically **Application Developer** or higher).
2. Create a new App Registration
   1. Go to: **Entra ID → App registrations**
   2. Click **New registration**
   3. Fill in:
      * **Name**: a recognizable name for your application (e.g., `Gaio Auth Provider`)
      * **Supported account types**: choose based on your scenario (most internal business cases use “Accounts in this organizational directory only”)
   4. Click **Register**
3. Copy the required IDs (Client ID and Tenant ID)
   1. After registration, on the app **Overview** page:
      1. Copy **Application (client) ID** → this is your **Client ID**
      2. Copy **Directory (tenant) ID** → this is your **Tenant ID**
4. Configure the Redirect URI (Callback URL)
   1. This step ensures Microsoft can redirect the user back to your application after sign-in.
      1. In the left menu, go to **Authentication**
      2. Click **Add a platform**
      3. Choose **Web**
      4. Under **Redirect URIs**, add the callback URL(s) provided by your developers (must match your app domain/routes)
      5. Save your changes
   2. Developer input required
      1. Your team must provide:
         * The exact **Redirect URI(s)** used by your frontend/backend sign-in callback routes
         * If applicable, the correct environment URLs (prod/staging/local)
5. Create a Client Secret
   1. In the left menu, go to **Certificates & secrets**
   2. Under **Client secrets**, click **New client secret**
   3. Enter:
      * **Description**
      * **Expiration**
   4. Click **Add**
   5. Copy the **Value** immediately (this is the **Client Secret**) — it will not be shown again after you leave the page
6. Save your credentials securely
   1. Store these values in your secrets manager or environment variables:
      * `TENANT_ID` = Directory (tenant) ID
      * `CLIENT_ID` = Application (client) ID
      * `CLIENT_SECRET` = Secret Value
      * `REDIRECT_URI` = the same redirect URI configured in Authentication

### Best Practices

* Always enable **2FA** for sensitive or enterprise environments.
* Configure an appropriate **session timeout.**
* Prefer **SSO providers** for corporate projects.
* Disable conventional login if only SSO is required.
* Periodically review authentication policies.


# SMTP

<figure><img src="/files/gxBIWUKB15azHJ6Jj9qb" alt=""><figcaption></figcaption></figure>

The **SMTP Settings** section allows you to configure an email server used by Gaio DataOS to send system notifications, alerts, and transactional messages (such as user invitations, password resets, and system events). This configuration is **global per project** and must be enabled for email delivery to work.

## Accessing SMTP Settings

1. Insert the address of your SMTP server, such as `smtp.office365.com` , `smtp.gmail.com`,etc.
2. Configure the SMTP port used by your provider.
3. Defines the encryption method used for the SMTP connection (TSL or SSL).
4. Create a display name that will appear as the sender of system emails.
5. Insert the email account used to authenticate with the SMTP server.
6. Insert the password associated with SMTP user.

{% hint style="info" %}
When using **Microsoft / Office 365 SMTP**, enable this option. This applies Microsoft-specific handling and compatibility settings for authentication.
{% endhint %}

7. Turns SMTP delivery on or off.
   * When **enabled**, Gaio will attempt to send emails using the configured server
   * When **disabled**, no system emails will be sent

### Testing the SMTP Connection

Before saving, always validate your configuration:

1. Click **Test SMTP Connection**
2. Gaio will attempt to authenticate and send a test message
3. If successful, the configuration is ready for use
4. If it fails, review:
   * Host and port
   * Encryption type
   * Credentials
   * Firewall or email provider restrictions

### Saving the Configuration

After a successful test:

1. Click **Save**
2. The SMTP configuration becomes active immediately
3. All system notifications will start using this email server

### Common SMTP Providers

| Provider   | Host                      | Port | Encryption |
| ---------- | ------------------------- | ---- | ---------- |
| Office 365 | smtp.office365.com        | 587  | TLS        |
| Gmail      | smtp.gmail.com            | 587  | TLS        |
| SendGrid   | smtp.sendgrid.net         | 587  | TLS        |
| Amazon SES | email-smtp..amazonaws.com | 587  | TLS        |


# Tags & Access Control

<figure><img src="/files/zy3WsAgoJ7zk0GfV3tNG" alt=""><figcaption></figcaption></figure>

The **Tags** section allows administrators to control **access permissions** across the platform by assigning tags to users, groups, projects, and sources. This mechanism enables **fine-grained authorization**, making it possible to define who can access what, without hardcoding permissions at the resource level.

Tags act as **permission bridges** between:

* **Who** (users or groups)
* **What** (projects or data sources)

Once a tag is granted, any user or group associated with that tag gains access to the selected resources.

### How to grant access to a project

1. Defines who will receive access. You can grant tags to:
   1. **Groups** (recommended for scalable access control)
   2. Individual users
2. Defines **which resources will be accessible**. Supported sources:
   1. Projects
   2. **Sources** (databases, files, APIs, connectors)
3. Click **Grant** to apply permissions

### Common Use Cases

* Restrict sensitive data sources to specific teams.
* Grant read/write access to analytics projects by department.
* Manage multi-tenant environments with isolated permissions.
* Simplify onboarding by assigning users to pre-configured groups.

<br>


# Users

<figure><img src="/files/hO54Eb57CpM8KoNabGFx" alt=""><figcaption></figcaption></figure>

The **Users** section allows administrators to create and manage users, define their roles, assign groups, and control access across the Gaio DataOS environment.

## Creating a New User

To create a new user:

1. Click **New.**
2. Select the **User Type.**
3. Fill in the required user information (mail and password).
4. Assign the user to a **Group (optional).**
5. Select the interface **Language.**
6. Click **Save.**

***

## **User Types (Roles)**

#### **User**

Designed for business users and dashboard consumers.

**Access:**

* Dashboards explicitly shared with the user
* Read-only interaction with analytics and visualizations

**Restrictions:**

* No access to Studios
* No access to data pipelines, tasks, or modeling
* No access to environment settings

**Typical use cases:**

* Executives
* Business analysts
* Stakeholders consuming insights

#### **Developer**

Designed for users responsible for building and maintaining data workflows.

**Access:**

* Studios (ETL, Analytics, AI, Tasks)
* Dashboards
* Project-level data sources and resources (based on assigned permissions)

**Restrictions:**

* No access to global environment **Settings**
* Cannot manage users or authentication providers

**Typical use cases:**

* Data engineers
* Analytics engineers
* Technical analysts

#### Admin

Designed for full platform governance and system administration.

**Access:**

* Full access to all dashboards and studios
* Full access to all projects and data sources
* Full access to **Settings**, including:
  * Users
  * Tags
  * Authentication providers
  * SMTP
  * White Label
  * AI and API keys

**Typical use cases:**

* Platform administrators
* IT and security owners
* System owners

***

### User Status

Each user account can be set to:

* **Active** – User can log in and access the platform
* **Inactive** – User is disabled and cannot log in

***

### Groups & Permissions

* Users inherit permissions from their assigned **Group**
* Groups are connected to projects and sources using **Tags**
* This model enables centralized, scalable access control

***

### Best Practices

* Assign permissions through **Groups**, not individual users.
* Use the **User** role for dashboard-only access.
* Use the **Developer** role for data and pipeline development.
* Limit the **Admin** role to a small, trusted group.
* Regularly review user access and inactive accounts.

{% hint style="warning" %}
The **Users & Roles** system in Gaio DataOS is designed to ensure security, scalability, and clarity by granting each user the appropriate level of access—no more, no less.
{% endhint %}


# AI

The **AI** section in Settings allows administrators to manage **AI providers**, define **data-sharing policies**, and control how contextual information is shared with AI models during analysis, conversations, and agent executions.

<figure><img src="/files/y7kcNuV0Lb51V015cpIy" alt=""><figcaption></figcaption></figure>

## Data Sharing Permissions

At the top of the page, you can configure **what type of data is allowed to be shared** with AI providers. These settings apply globally and define the privacy and governance boundaries of AI usage inside Gaio DataOS.

#### 1. Metadata

Basic structural information about tables is shared.

**Included**

* Column name
* Column title
* Data type

**Excluded**

* Sensitive data values

**Purpose**\
Helps the AI understand schema structure without accessing actual data.

#### 2. Table Sample Data

A limited subset of table data is shared.

**Included**

* First 10 rows
* Sensitive data (if enabled)

**Purpose**\
Improves contextual understanding for more accurate responses in conversations involving data interpretation.

#### 3. Analytics

Derived analytical information from tables.

**Included**

* Frequency distributions
* Metrics
* Analytical summaries
* Sensitive data (if enabled)

**Purpose**\
Allows the AI to reason over patterns, trends, and aggregates rather than raw data only.

#### 4. Results Sample

A subset of query execution results is shared.

**Included**

* First 10 query results
* Sensitive data (if enabled)

**Purpose**\
Provides execution context for follow-up questions and complex analytical reasoning.

***

## Creating or Editing an AI Configuration

1. Navigate to **Settings → AI**
2. Click **New** or **Edit** on an existing configuration
3. Fill in the following fields:

#### Fields Description

* **Name**\
  Internal identifier for the AI configuration.
* **Supplier**\
  Select the AI provider (e.g., OpenAI, Anthropic, DeepSeek).
* **Model**\
  Choose the specific model available for the selected supplier (e.g., GPT-4, Claude Opus, DeepSeek Chat).
* **API Key**\
  Paste the provider-issued API key. This key is stored securely and used at runtime.

4. Click **Save**

***

### Preferential Model

You can mark one AI configuration as **Preferential**.

* The preferential model is used by default across:
  * Dashboards
  * Agents
  * AI-powered features
* Other models remain available for manual selection or advanced use cases.

### Governance and Security Notes

* Sensitive data sharing is **explicitly controlled** per data scope.
* API keys are never exposed to end users.
* AI suppliers only receive the data scopes you explicitly enable.
* You can mix providers (e.g., OpenAI + Anthropic) in the same environment.

### Best Practices

* Start with **Metadata only**, then progressively enable sample data if needed.
* Use **Table Sample Data** for exploratory analysis and schema discovery.
* Enable **Analytics** only when deeper statistical reasoning is required.
* Define one **Preferential model** to keep behavior consistent.
* Use different providers to compare quality, cost, and performance.

{% hint style="info" %}
This configuration layer ensures Gaio’s AI capabilities remain **powerful, transparent, and compliant**, while giving teams full control over how intelligence is applied to their data.
{% endhint %}


# MCP API Keys

<figure><img src="/files/INX9ex0XlqKk7Cjst0CA" alt=""><figcaption></figcaption></figure>

The **MCP API Keys** section allows you to create and manage secure access keys used by **MCP tools and integrations** within Gaio DataOS. These keys control which projects can access MCP-enabled capabilities and external integrations.

***

### What is an MCP API Key?

An MCP API Key is a **project-scoped authentication token** used to:

* Authorize MCP tools
* Enable secure communication between Gaio and external MCP-compatible services
* Control access at the project level

Each key can be independently enabled, rotated, and assigned to one or more projects.

***

### Viewing Existing MCP API Keys

Navigate to:

**Settings → MCP API Keys**

In this screen, you will see a list with the following columns:

* **ID**\
  Internal identifier of the key.
* **Status**\
  Indicates whether the key is:
  * `Active` – Key can be used normally
  * `Inactive` – Key is disabled and cannot be used
* **Name**\
  Human-readable name to identify the purpose of the key (e.g., *OpenAI*, *Internal MCP*, *Automation Key*).
* **Token**\
  The secret value used for authentication.
  * Tokens are hidden by default
  * You can **Renew** the token at any time
* **Projects**\
  Number of projects where this key is enabled.

***

### Creating a New MCP API Key

1. Click **New**
2. Fill in the following field:
   * **MCP API Key Name**\
     A descriptive name for the key
3. Toggle the **Status** to `On` if you want the key active immediately
4. Click **Add**

The key will be generated automatically.

***

### Assigning Projects to an MCP API Key

<figure><img src="/files/xuinRkpi3nD1xZQdBexT" alt=""><figcaption></figcaption></figure>

After creating the key:

1. Click on the **Projects** badge
2. Select one or more projects
3. Confirm the assignment

Only the selected projects will be able to use this MCP API Key.

***

### Renewing an MCP API Key

If a token is compromised or needs rotation:

1. Locate the key in the list
2. Click **Renew**
3. A new token will be generated
4. Update any external systems that depend on this key

{% hint style="danger" %}
&#x20;Renewing a token immediately invalidates the previous one.
{% endhint %}

***

### Editing or Deleting a Key

* **Edit**\
  Allows you to update the key name or assigned projects.
* **Delete**\
  Permanently removes the key.
  * Any integration using this key will stop working immediately.

***

### Best Practices

* Use **one MCP API Key per integration or purpose**
* Assign keys only to the **projects that truly need access**
* Rotate keys periodically using **Renew**
* Disable or delete unused keys
* Never share tokens in public repositories or client-side code

***

### Security Notes

* MCP API Keys are stored securely and masked in the UI
* Tokens are only shown at creation or renewal time
* Access is enforced at the **project level**
* Keys can be revoked instantly by disabling or deleting them

***

{% hint style="info" %}
MCP API Keys provide a **controlled, auditable, and secure** way to connect Gaio DataOS with MCP-enabled tools and external systems.
{% endhint %}


# Project Share

<figure><img src="/files/TTDWaQ8eEx4o6Dgfh24W" alt=""><figcaption></figcaption></figure>

The **Project Share** feature allows administrators to control **who can access specific projects** within the environment. This mechanism ensures proper segregation of data, dashboards, and studios across teams, users, or external collaborators.

***

### Purpose of Project Share

Project Share is used to:

* Grant access to projects without changing global user roles
* Share projects selectively with users or groups
* Enforce least-privilege access across environments
* Support multi-team or multi-client setups

Access granted here directly impacts visibility of:

* Dashboards
* Studios
* Project-level resources

***

### Step-by-Step: Sharing Projects

#### 1. Access Project Share

Navigate to:

**Settings → Project Share**

***

#### 2. Select Who Will Receive Access

At the top of the screen, use **Grant to** to select:

* A **Project**

This defines **which** project will receive access to bucket tables.

***

#### 3. Choose Projects to Share

The screen is divided into two panels:

**Available items (left)**

* Displays all projects you are allowed to share
* Includes:
  * Search field
  * Item counter
  * **Select all** option

**Selected items (right)**

* Displays projects already selected for sharing
* Initially empty if no project is selected

***

#### 4. Select Projects

* Check the box next to each project you want to share
* Selected projects will appear in the **Selected items** panel
* You can:
  * Search projects by name
  * Select multiple projects
  * Remove individual selections or use **Remove all**

***

#### 5. Apply Changes

Once the desired projects appear under **Selected items**:

* Click **Apply**

Access is granted immediately.

***

### Resulting Permissions

After applying:

* The selected **project** will gain access to:
  * All shared tables.

***

### Modifying or Revoking Access

You can update project sharing at any time:

* Reopen **Project Share**
* Change selected projects
* Click **Apply** again

Changes take effect immediately.

***

### Best Practices

* Share only the projects required for the user’s responsibilities
* Regularly audit shared projects to avoid overexposure

***

### Security Notes

* Removing a project instantly revokes access
* No logout or refresh is required
* Access control is enforced in real time

{% hint style="info" %}
Project Share provides **granular, auditable, and scalable access control** at the project level.
{% endhint %}


# Gaio User Manager API

This documentation describes the Gaio User Manager API, based on the OpenAPI 3.0 specification.

### Users API

#### GET /api/auth/manager/users/{page}

**Description:** Retrieves all users.

**Parameters:**

* `page` (path, optional): Page number.

**Responses:**

* `200 OK`: Returns all users.

  **Response Example:**

  ```json
  jsonCopyEdit{
    "userId": 1,
    "name": "Gaio User",
    "email": "gaio.user@gaio.io",
    "status": "active",
    "groups": [
      "Analytics team",
      "Development team",
      "RH team"
    ]
  }
  ```

***

#### GET /api/auth/manager/user/{userId}

**Description:** Retrieves a single user.

**Parameters:**

* `userId` (path, required): User ID.

**Responses:**

* `200 OK`: Returns the user.

  **Response Example:**

  ```json
  jsonCopyEdit{
    "userId": 1,
    "name": "Gaio User",
    "email": "gaio.user@gaio.io",
    "status": "active",
    "groups": [
      "Analytics team",
      "Development team",
      "RH team"
    ]
  }
  ```

***

#### POST /api/auth/manager/create-user

**Description:** Creates a new user.

**Parameters:**

* `body` (request body, required): Data for the user to be created.

  **Request Example:**

  ```json
  jsonCopyEdit{
    "name": "New User",
    "email": "new.user@gaio.io",
    "password": "securePassword123",
    "groups": [
      "Development team"
    ]
  }
  ```

**Responses:**

* `200 OK`: User successfully created.

  **Response Example:**

  ```json
  jsonCopyEdit{
    "userId": 2,
    "name": "New User",
    "email": "new.user@gaio.io",
    "status": "active",
    "groups": [
      "Development team"
    ]
  }
  ```

***

#### POST /api/auth/manager/status

**Description:** Changes the status of a user.

**Parameters:**

* `body` (request body, required): User ID and new status.

  **Request Example:**

  ```json
  jsonCopyEdit{
    "userId": 0,
    "status": "active"
  }
  ```

**Responses:**

* `200 OK`: User status successfully updated.

***

#### POST /api/auth/manager/update

**Description:** Updates user information.

**Parameters:**

* `body` (request body, required): Data of the user to be updated.

  **Request Example:**

  ```json
  jsonCopyEdit{
    "userId": 1,
    "name": "Updated Gaio User",
    "email": "gaio.user.updated@gaio.io"
  }
  ```

**Responses:**

* `200 OK`: User successfully updated.

***

#### POST /api/auth/manager/update-password

**Description:** Updates a user's password.

**Parameters:**

* `body` (request body, required): User ID and new password.

  **Request Example:**

  ```json
  jsonCopyEdit{
    "userId": 0,
    "password": "newSecurePassword"
  }
  ```

**Responses:**

* `200 OK`: User password successfully updated.

***

#### DELETE /api/auth/manager/delete

**Description:** Deletes a user.

**Parameters:**

* `body` (request body, required): ID of the user to be deleted.

  **Request Example:**

  ```json
  jsonCopyEdit{
    "userId": 0
  }
  ```

**Responses:**

* `200 OK`: User successfully deleted.

***

### Groups API

#### POST /api/auth/manager/create-group

**Description:** Creates a new group.

**Parameters:**

* `body` (request body, required): Name of the group to be created.

  **Request Example:**

  ```json
  jsonCopyEdit{
    "name": "New Group"
  }
  ```

**Responses:**

* `200 OK`: Group successfully created.

***

#### DELETE /api/auth/manager/delete-group

**Description:** Deletes a group.

**Parameters:**

* `body` (request body, required): ID of the group to be deleted.

  **Request Example:**

  ```json
  jsonCopyEdit{
    "groupId": 0
  }
  ```

**Responses:**

* `200 OK`: Group successfully deleted.

***

#### GET /api/auth/manager/groups/{page}

**Description:** Retrieves all groups.

**Parameters:**

* `page` (path, optional): Page number.

**Responses:**

* `200 OK`: Returns all groups.

  **Response Example:**

  ```json
  jsonCopyEdit{
    "groupId": 1,
    "name": "Example Group"
  }
  ```

***

#### POST /api/auth/manager/group/grant

**Description:** Assigns user groups.

**Parameters:**

* `body` (request body, required): User ID and group IDs to be granted.

  **Request Example:**

  ```json
  jsonCopyEdit{
    "userId": 0,
    "groupIds": [
      0
    ]
  }
  ```

**Responses:**

* `200 OK`: User groups successfully assigned.

***

#### POST /api/auth/manager/group/revoke

**Description:** Revokes user groups.

**Parameters:**

* `body` (request body, required): User ID and group IDs to be revoked.

  **Request Example:**

  ```json
  jsonCopyEdit{
    "userId": 0,
    "groupIds": [
      0
    ]
  }
  ```

**Responses:**

* `200 OK`: User groups successfully revoked.

***

### Permissions API

#### POST /api/auth/manager/tag/grant

**Description:** Adds app/source permission to a user/group.

**Parameters:**

* `body` (request body, required): User/group ID and permission tags.

  **Request Example:**

  ```json
  jsonCopyEdit{
    "userId": 0,
    "tags": [
      "admin"
    ]
  }
  ```

**Responses:**

* `200 OK`: Permission successfully added.

***

#### POST /api/auth/manager/tag/revoke

**Description:** Removes app/source permission from a user/group.

**Parameters:**

* `body` (request body, required): User/group ID and permission tags to be revoked.

  **Request Example:**

  ```json
  jsonCopyEdit{
    "userId": 0,
    "tags": [
      "admin"
    ]
  }
  ```

**Responses:**

* `200 OK`: Permission successfully removed.


# E-commerce e Social Commerce

<figure><img src="/files/Vbx2CIYR0lRgSnmdur1Y" alt=""><figcaption></figcaption></figure>

### Project Overview

This project demonstrates how to use **Gaio DataOS** to build a complete analytical solution for **E-commerce and Social Commerce**, covering everything from **data extraction** to **predictive modeling** and **interactive dashboards**.

***

## &#x20;Development Steps

### 1. Data Extraction

<figure><img src="/files/bCSFhpwKlcVVNUJ9p0UT" alt=""><figcaption></figcaption></figure>

* Connect multiple data sources: PostgreSQL, MySQL, and CSV files.
* Use **ETL blocks** in Gaio to:
  * Clean and transform data
  * Create relationships across tables
  * Store intermediate data in temporary tables like:
    * `tmp_orders`, `tmp_customers`
* Create final analytical tables:
  * `customers_sales`
  * `orders_sales`
  * `abandoned_carts_sales`
  * `social_interactions`

***

### 2. Data Preparation

<figure><img src="/files/x9SkYni29jXRmLW75Kze" alt=""><figcaption></figcaption></figure>

* Build a **unified flat table** named `sales_ecommerce` that combines:
  * Sales, visits, customer profile, social engagement, and abandoned cart data
* This table is optimized for dashboards, exploration, and machine learning.

***

### 3. Predictive Analytics

#### **3.1 Churn Prediction**

<figure><img src="/files/MMYcHwulopokiPx22VYX" alt=""><figcaption></figcaption></figure>

* Use the `sales_ecommerce` table.
* Engineer features like: last purchase, frequency, engagement.
* Use AutoML to predict churn probability.
* Output tables:
  * `forecast_churn`: churn score per customer
  * `forecast_churn_metrics`: model performance (ROC, accuracy, etc.)

#### **3.2 Customer Profiling**

<figure><img src="/files/9x1zOr5cWzBZyiuSD5cO" alt=""><figcaption></figcaption></figure>

* Generate customer features: RFM, purchase gaps, preferred categories.
* Apply AutoCluster (K-Means) for customer segmentation.
* Interpret clusters based on behavior and buying patterns.

#### **3.3 Demand Forecasting**

* Aggregate order data by time, category, and channel into `tmp_order_demand`.
* Apply time series models using the Forecast module.
* Output tables:
  * `forecast_order_demand`
  * `forecast_order_demand_metrics`

***

### 4. Interactive Dashboards

Use Gaio’s visual dashboard builder to create:

* **Sales Ecommerce Overview**:
  * Total sales, channels, abandoned carts, social engagement.
* **Customer Detail View**:
  * Individual customer metrics and lifecycle behavior.
* **Forecast Demand Panel**:
  * Projected sales by time, product category, and channel.
* **Churn Monitoring**:
  * Identify and track at-risk customers.
* **Customer Clustering**:
  * Visualize segmented profiles for marketing and personalization.

***

### Technologies Used

* **Visual ETL workflows** in Gaio DataOS
* **Temporary and Final Tables** for data versioning
* **AutoML and Clustering** with assisted interface
* **Dynamic Dashboards** with filters, graphs, and tables
* **Discovery Module** for AI-generated insights (recommended)

***

### Expected Outcomes

* Reduced time for building analytical workflows
* Centralized multi-source data in a single platform
* Actionable predictions for churn and demand planning
* End-to-end visibility across ecommerce performance

***

### Download this project

{% file src="/files/2AriijVg8OUV8pcSyzjJ" %}

{% file src="/files/xbgTVkGtVfMOg7Xurw6C" %}


# Financial Anomaly Detection

<figure><img src="/files/fCIC4riFG3SpXjUAiG29" alt=""><figcaption></figcaption></figure>

## Project Overview

This project demonstrates how to use Gaio DataOS to build an application that detects financial anomalies based on given financial transaction information.

Using this application, users are able to:

* Import financial transaction data
* Detect, classify, and view analytics&#x20;
* Insights regarding financial anomalies within their transactions.

***

## Development Steps

### 1. Data Extraction

<figure><img src="/files/0zMXdH4Z02WUBezxkcDL" alt=""><figcaption></figcaption></figure>

* Connects to **ClickHouse Cloud** or imports **CSV**
* Uses builder tasks in Gaio to:
  * Import data
  * Clean and transform data
* The import process ends in the flat table tb\_financial\_anomaly

***

### 2. Anomaly Detection

<figure><img src="/files/6MyzYM2Jhs4O4n2TRDzy" alt=""><figcaption></figcaption></figure>

Detection logic is split into SQL builders to identify:

* `Large Expense`
* `Duplicate Transaction`
* `After Hours Transaction`
* `Repeat Reimbursement`
* `Revenue Spike`
* `Refund Surge`

Each detected anomaly receives:

* A **severity score**
* A unique **`anomaly_id`**
* Enriched metadata

> 💡 **Note:** If multiple anomalies occur in the same transaction, each one receives a different `anomaly_id`.

Final consolidation into: **`detected_anomalies`**

***

### &#x20;3. Dashboards and Interfaces

#### 3.1 Suspicious Transactions Monitor

<figure><img src="/files/tDC43Ztc6lgm92w738Ie" alt=""><figcaption></figcaption></figure>

* Uses the detected\_anomalies and anomaly\_classification\_history tables.
* Analytics like count of anomalies, number of each classification type, and distribution of anomaly severity are created using Report tasks and displayed on the dashboard
* A set of filters is created using the Form task to allow a user to filter by date, transaction type, sector, category, and payment type
* There is also a flat table that shows most recent classifications and a table showing all anomalies that need to be classified
* Using the anomalies awaiting classification table, users can classify an anomaly or view more specific anomaly details by clicking on its ID.

***

#### 3.2 Anomaly Classification

<figure><img src="/files/LKVsmx829ncZEHsd6cKB" alt=""><figcaption></figcaption></figure>

<figure><img src="/files/IvYyt3vQtSmVoyESk3rF" alt=""><figcaption></figcaption></figure>

* By clicking the leftmost icon in the anomalies awaiting classification table, users can classify an anomaly using the form task
* Some fields in the form will auto-complete with information from the chosen anomaly using parameters
* When the Form is submitted, the Update Anomaly Classification process will run, this process is comprised of two major parts:
  * Update task edits the current anomaly row in the detected\_anomalies table
  * Incremental builder task adds a new row with the anomaly and classification to the anomaly\_classification\_history table

***

#### 3.3 Anomaly Details

<figure><img src="/files/L6nzISq4ClgBAGNLH2yw" alt=""><figcaption></figcaption></figure>

* Clicking an `anomaly_id` opens a **dedicated dashboard**
* Tables used:
  * `detected_anomalies`
  * `tb_financial_anomaly`
* Uses parameters for dynamic filtering

Includes:

* Risk level card
* Insights based on anomaly type
* Charts:
  * Line chart (monthly averages)
  * Bar (by sector, category)
  * Pie (by customer/vendor)
* Transaction history table
* Styled using **HTML & CSS**

***

#### 3.4 Confirmed and Under Investigation Dashboards

<figure><img src="/files/lUpnxL5mfabXVXVxg6Q9" alt=""><figcaption></figcaption></figure>

* Two dedicated dashboards using `detected_anomalies`
* Show:
  * Confirmed anomalies
  * Pending anomalies
* Built with **Report Task**

***

### Technologies Used

* Visual ETL workflows in Gaio DataOS
* Temporary and Final Tables for data versioning
* Report and Content tasks to create adaptive, visually interesting dashboards
* Dynamic Dashboards with filters, graphs, and tables
* HTML and CSS for stylized and user-responsive dashboard elements
* Form Task to allow for anomaly classification without leaving the dashboard
* Parameters for data pass through enabling easy navigation of the dashboard

***

### &#x20;Expected Outcomes

* Faster development of anomaly detection logic
* Centralized monitoring dashboards
* Better financial control and audit tracking
* Secure access via permissioned users/groups

***

### Download this project

{% file src="/files/cVCgQPURoPrCyL4fmLZT" %}

{% file src="/files/kKdwuJosibZBIusEjlsU" %}


# Data Mart

<figure><img src="/files/PoRwJxaBBtxfN4d7M5Lk" alt=""><figcaption></figcaption></figure>

## Project Overview

To build a **modular and scalable Data Mart** within **Gaio DataOS**, organizing operational data by domain (Customers, Orders, Products, and Order Items), enabling descriptive, operational, and predictive analytics.

***

## Development Stages

### 1.  Validation and Process Trigger

<figure><img src="/files/etcZrydYtxM3ukyEHncr" alt=""><figcaption></figcaption></figure>

* The project starts with an automatic data update check.
* SQL Control Table creates tmp\_tb\_control\_data\_update.
* Flow:
  * `tmp_tb_control_data_update`: checks for updates
  * `tb_control_data_update`: stores execution status
  * If new data is detected, the main extraction flow is triggered automatically.

***

### 2.  Data Extraction

<figure><img src="/files/PoRwJxaBBtxfN4d7M5Lk" alt=""><figcaption></figcaption></figure>

* Data is extracted from **data sources**, **CSV files** or **APIs at Gaio**.
* Uses **Builder tasks** for:
  * Data transformation
  * Handling nulls and errors
  * Standardizing formats
* Intermediate results are stored in **temporary tables (`tmp_`)**.
* Final consolidation and versioning are done in **final tables (`tb_`)**.

***

### 3. Domain-Based Structure

Each domain follows this modular structure:

```
Source → Staging Builder → Temporary Table (`tmp_`) → Final Builder → Final Table (`tb_`)
```

***

#### 3.1  Customers Domain

<figure><img src="/files/kedsPIB0eJ3WUGPAyiFK" alt=""><figcaption></figcaption></figure>

* Source: PostgreSQL (`customers`)
* Steps:
  * Filter out invalid data
  * Normalize and enrich information
  * Build `tmp_customers`, then publish to `tb_customers`

***

#### 3.2  Orders Domain

<figure><img src="/files/B5UcWmRqCTy7xndCdrrp" alt=""><figcaption></figcaption></figure>

* Source: PostgreSQL (`orders`)
* Steps:
  * Calculate totals, shipping fees, estimated delivery
  * Status and failure normalization
  * `tmp_orders` → `tb_orders`

***

#### 3.3  Products Domain

<figure><img src="/files/6eAsqMoFjUxmAbUI2sO3" alt=""><figcaption></figcaption></figure>

* Source: PostgreSQL (`products`)
* Steps:
  * Enrich with category and availability
  * Add flags for discontinued products
  * `tmp_products` → `tb_products`

***

#### 3.4 Order Items Domain

<figure><img src="/files/uc0po7tIfWxh3YSuByGn" alt=""><figcaption></figcaption></figure>

* Source: PostgreSQL (`order_items`)
* Steps:
  * Clean up nulls and data types
  * Calculate taxes, discounts, unit values
  * `tmp_order_items` → `tb_order_items`

***

### &#x20;Technologies Used

* **Gaio DataOS** as the core platform
* **Visual ETL** with Builder, Form, Content, and SQL tasks
* **Temporary Tables (`tmp_`)** for staging and audit
* **Final Tables (`tb_`)** for downstream use
* **Dynamic Parameters** for context handling and automation
* **Conditional logic** to manage execution flow
* Ready for integration with **dashboards, AI and automation flows**

***

### Expected Outcomes

* Solid and auditable data processing pipelines
* Ability to rerun specific domains independently
* Accelerated dashboard development
* Reusable components for future projects
* Improved data trust and governance for business users
* Ready-to-use structure for **forecasting, clustering, and churn models**

***

### Download this project

{% file src="/files/sLo44bZHhwQAf61ENsJ9" %}

{% file src="/files/yyax9JXj1w2qGipF03oL" %}


# Gaio Community

<figure><img src="/files/0sUd9rRzfCyHF0zMQV4M" alt=""><figcaption></figcaption></figure>

This document provides a clear and structured overview of the implementation of a use case using the Gaio DataOS platform. The goal is to demonstrate how the platform can be leveraged to import, prepare, and analyze data through its integrated ETL, Analytics, and Delivery tools.

The project architecture was designed to support business intelligence processes by transforming raw data into meaningful reports and insights.

The solution is organized into sequential phases, including:

* Data Extraction
* Data Preparation
* Insert Products
* Delete Products
* Update Customer Status
* Delete Inactive Customers
* User Identification
* Customer Distribution
* Python Execution
* Basket Analysis
* Principal Component Analysis (PCA)
* Dashboard: Sales
* Dashboard: Customers
* Dashboard: Products
* Register Product

This documentation is intended to offer a comprehensive view of the architecture, logic, and transformations that support this use case, enabling a deeper understanding of how Gaio DataOS can be applied in practice.

***

### Download this project

{% file src="/files/ejd91OaZ9BFzixAvynAu" %}

{% file src="/files/KIdW6us3RLfdHfUlriuE" %}


# 2025


# Changelog

## V0.01156

### **New Features**

#### **Reports**

* New option to change the background color of charts.
* Independent ordering of chart legends, no longer dependent on column order.
* Support for category-based colors in stacked bar and stacked line charts.

#### **Other**

* REST: Added the **Abort** functionality for REST requests.
* SQL: Preliminary implementation of schema selector for external SQL connections.
* Data Sources: Evaluation and implementation of SQL Server 2000 compatibility.

***

### **Fixes**

#### **Reports**

* Fixed column chart tooltip that was not applying formatting correctly.
* Column chart tooltip now respects the correct ordering.
* Fixed unintended hiding of labels in column charts.
* Fixed numeric label compaction for Dual Axis charts.

#### **Other**

* Settings: Fixed behavior when deleting user groups.
* API: Fixed schema error when the "drop table" flag was enabled.
* API: Fixed environment issue that caused the API to stop working for creation and usage.
* Content: Temporary table selection now respects the correct user context.
* SQL Query now correctly lists bucket tables.
* Power Search: “Where in” filter now allows multiple selections.
* Power Search: Fixed flickering in bar and line charts when created.

#### **Builder**

* “is in list / is not in list” operators fixed for computed fields.
* Filter field no longer exceeds layout boundaries.
* Computed section scroll now reaches the end.
* When saving tasks, Gaio no longer waits for process execution to complete before closing windows.

#### **Forms**

* Checkbox now properly captures parameters when running in background execution.
* Added missing tooltips to make tasks more intuitive.
* Form Card: clicking outside the remove icon no longer triggers the wrong item.

***

### **Improvements**

#### **Reports**

* Visual refinements to avoid label overlap in Pie charts.
* Tables are now centered when pagination is disabled.
* Improved behavior when changing field formatting to percentage in bar charts.

#### **Consistency / UX**

* Standardization of buttons and languages on upload screens.
* Focus adjustments in Studio/Forms windows to ensure they always open in the foreground.
* Improved SQL Server version selection flow.
* Insights: Logical adjustment to display all contexts when "all" is selected.
* E-mail: Ensure all fields are available in both English and Portuguese.
* Dashboard & DataChat: New message shown to users when no dashboards exist (avoids loading only a “LOAD” state).
* Improved automatic positioning of new elements in the Studio.

#### **Diagrams**

* Initial adjustments to retain metadata when adding columns.
* Fixed behavior when dragging tables into the Diagram (prevents incorrect tables from being added).
* Added persistent icons and information in the Diagrams tab (profile, settings).

***

## V0.0.1051

### New Features

#### Reports

* Add color-by-category option in pie and donut charts.
* Add line configuration options: allow dashed lines, increase or decrease thickness.
* Implemented dual-axis chart.
* Migrated stacked column chart to G2Plot and enabled multiple metrics per dimension.
* Migrated stacked bar chart to G2Plot with support for multiple metrics per dimension.

#### Beta Features

* **AI Agent**: Enables creation of AI agents and custom logic linked to REST or SQL task responses.
* **Diagram**: Allows visual creation of entity-relationship diagrams between tables stored in Gaio.
* **File Ingestion**: New task that enables import of files, folders, and/or subfolders using FTP or SFTP protocols.

#### File Explorer

* Allow users to rename folder files.
* Allow users to create new folders for files.
* Improve performance when hovering over folders/files during drag.
* Add visual effect to indicate which folder is being dragged.
* Add collapse-all-folders button.
* Improve warning message when deleting folders and display their contents.
* Allow users to choose where to save files during import.
* Files: Add tooltips and translations for new buttons.

***

### Fixes

#### Reports

* Fixed duplicate formatting in column chart.
* Gauge chart label position was not working correctly.
* Scatter Plot label value did not match tooltip data — fixed.
* Heatmap chart had no icon and duplicated another chart’s image — corrected.
* Table: dynamic config was not capturing all icons.
* Parameter was not correctly applied as chart title — fixed.

#### Other Fixes

* API: Fixed conflicting text on buttons (e.g., increment vs. drop).
* Power Search: Fixed tooltip and translation errors on the home page.
* Fixed hidden field display issue.
* Forms Card: Edit button was not working.
* Forms: Parameter error prevented data display — resolved.
* Parameter with “between” filter did not capture `all_`, returned NaN — corrected.
* Content: Fixed incorrect task icon when opened.
* AI Dashboard: When deleting an AI dashboard, the user was redirected to a suspended window — now fixed.
* Database: Snowflake driver was missing — installed.
* Snowflake: Adjusted data source configuration.
* Oracle: Queries didn’t return all rows for tables with more than 7M records — corrected.
* Window background was fully transparent, causing visibility issues — fixed with solid background.
* Translation fix: “Value to Pivot” field was renamed correctly to “Sort”.
* Execution Rules: When pausing a task to prevent it from running in complete workflows, reopening and saving the task reset the pause setting — now retained.
* Content: When extracting data from a temporary table in a dashboard, the user context must be preserved — enforced.
* Power Search: Now allows selecting more than one value in “Where in” filters.

***

### Improvements

#### Reports

* Improved label visibility in gauge charts.
* Enabled manual positioning of gauge chart labels.
* Dual-axis chart: refined icons and visual behavior.
* Allow editing of Y-axis title in multi-metric line charts.
* Improved gauge color division options.
* Table: Allow character limits in word display.
* Totalizers added to columns in stacked bar and column charts.

#### API

* Adjusted tooltip labels and translations.
* API documentation translated into Portuguese.
* API Key: Added copy-to-clipboard button for token field.
* Improved display of parameters and messages in endpoints.

#### General Interface

* Export App: Added scroll to view all parameters.
* Table: Improved filter field size for better readability.
* Content: Added file search capability to input/output tabs.
* Content: Documentation translated into Portuguese.

***

## V0.0.931

### New Functionalities

#### E-mail

* Enable the use of conditional logic for email sending.
* Add a button to test email with custom recipient.
* Allow sending HTML-formatted emails using conditional rules.

#### Reports

* Migrate the Scatter Plot chart to the G2Plot library.
* Add radar chart with 2 dimensions and 1 metric.
* Implement column totalizer (sum of columns).
* Implement row total (sum of rows).
* Implement Forecast chart with slider.
* Add option to change axis scale in charts.
* Add color by category for line charts.

#### SQL / Connections

* Allow administrative SQL commands, such as `SHOW CREATE TABLE`.
* Add schema selection option for PostgreSQL and SQL Server.
* Add refresh connection button in Source component.

#### Other

* **Form Card**: Add option “Do not use CARD visual on dashboard”.
* **AutoML**: Save output tables with naming format: `model_name_metric`.
* Add support for new **Boolean** field type.
* Add support for new **JSON** field type.
* Allow iframe/image preview when accessing a dashboard via portal with content.
* Enable filtering in tables by comparing two columns.
* **REST**: Allow sending batch data.
* **API**: Support receiving POST requests with JSON in the body.

***

### &#x20;Fixes

#### AI Chat / Dash AI

* Fixed context switching between AI dashboards when opening new chats.
* Fixed incorrect dashboard when adding new AI chart.

#### AutoML

* Removed drop button and ensured table is always dropped when rerunning the task.
* Adjusted decimal display to 2 digits in result view.
* Fixed model reading issue in Scoring task.

#### Tables / Builder / Forms

* Fixed preview behavior when queries contain errors.
* Fixed issue where closing button (X) was misaligned when selecting multiple values in a form.

#### Reports and Dashboards

* Fixed incorrect summing behavior in area charts.
* Fixed missing legends in donut charts.
* Fixed radar chart rendering when only one category was applied.
* Fixed Forecast chart not rendering even with valid data.
* Adjusted tooltip configuration.
* Fixed missing scrollbar in Dashboard.
* Adjusted display and number compacting in donut charts.

#### Other

* Enabled viewing tables from external SQL tasks.
* Fixed backend overload caused by excessive requests when moving/resizing reports.
* Fixed missing data rendering in maps from shared projects.
* Fixed inability to create new applications.
* Adjusted missing scrollbar in Builder for aggregation fields.
* Fixed incorrect start/end time in Monitor task execution.
* Adjusted filters in Monitor tabs.
* Retained Studio access after logging back in post-portal creation.
* Prevented automatic user creation when creating new portal.
* **Email**: Fixed configuration fields not saving correctly.

***

### Improvements

#### Reports

* Apply meta/format only to the configured dimension.
* Show total label only on compatible chart types.
* Improve table rendering when “show table” is active in charts.
* Adjust label rotation for axis values.
* Improvements in **Heatmap** (theme, refresh, tooltip).
* Enabled removing zero counts in bar charts using categorical columns.

#### Dashboards / Dash AI

* Improved flow to prevent stacking elements in AI dashboard data flows.
* Display selected visualization type in dashboard: desktop, tablet, and mobile.
* Improved error messages when dashboard is not created.

#### General / Other

* Improved visualization of selection fields across multiple areas.
* Indicate that the error button in Monitor is clickable.
* **Builder**: Improved aggregation options for date and datetime fields.
* Improved positioning and visuals for new elements in Studio.

***

## v0.0.857

### New Features

#### Tasks and Components

* New email sending task available in the system.
* Added full calendar navigation (year, month, day) to date fields in forms.
* Exclusive icon created for download card-type reports.

#### Maps

* Added option to link and open another process directly from the map.
* Implemented parameter relation with the selected column in the map.

***

### Improvements

#### Dashboards

* Floating window now allows insertion of parameter visualizations.
* Drag-and-drop enabled for floating window.
* Floating window allows enabling/disabling grid in developer view.

#### Forms

* Required field prevents submission without filling.
* Visual control for button size added in Form Card.

#### General

* TaskUpload component layout improved.
* InsertRow and InsertTable layouts standardized.
* Confirmation added when resetting dashboard layout.
* Close button standardized in Gaio Assistant.
* Builder now starts directly from table view.
* AI execution maintenance after error implemented.

***

### Fixes

#### Dashboards

* AI button hidden from the end-user view.
* Floating window was being displayed as a task — visual adjusted.
* Errors when opening dashboards or Data Chats are no longer displayed in other projects.

#### Reports

* Download card was non-functional — feature restored.
* Donut chart and similar legends now display correctly.
* Line charts now correctly recognize and plot the right scale.
* Dynamic field now accepts conditional functions.
* Scatter chart title on the Y-axis is now displayed.
* Stacked chart tooltip on the Y-axis now appears correctly.

#### Forms

* Fixed current flow reload.
* Edit fields button now works.
* Now allows changing the field type in an already created field.

#### AI / Data Chat / Threads

* Dash AI fixed: table change now replaces columns correctly.
* AI threads are deleted when user permission is removed.
* Duplicated Python projects now bring packages correctly.

#### SQL and Tables

* External SQL now correctly retains selected database.
* Table visualization via SQL restored.
* Decimal type correctly added when creating tables.

#### Studio and Builder

* Studio close button adjusted to visual standard.
* Builder aggregation field now has visible scrolling on small screens.

#### Portal / Users

* Creating a new portal no longer deletes public information from other portals.
* User no longer loses access to Studio after logging out in a new portal.
* Iframe or image information now passes correctly between portal tasks.
* Portal creation no longer automatically generates a technical user.

#### General

* Task code is no longer lost when moving a task between processes.
* Monitor now correctly displays execution time.
* Cluster error investigated and fixed.
* Content now opens table view correctly.
* Upload progress now displays fewer decimal places.
* AutoML now shows execution status when reopening the model.

***

## v0.0.819

### &#x20;New Features

* Bar/column charts: Added "color by category" option.
* External SQL task: Can now be saved without a final table.
* Welcome screen and account verification added to Docker setup.
* Version field added to general settings.
* Portal.

***

### Improvements

#### Reports & Dashboards

* Tooltip in line charts now sorts by highest value by default.
* Gauge chart margin rendering improved.
* Dialog flow panel height adjusted for better display.

#### Forms & Parameters

* Read-only fields now display parameters when used as filters.
* Button size control added to the Form Card.

#### SQL, Studio, Builder & Projects

* Advanced filters now support multiple values and date conditions.
* Builder parameter visibility improved for smaller screens.
* Tooltip added to "duplicate application" button.
* Execution rules are now preserved when pausing/restarting tasks.

#### General Interface

* Scrollbars now only appear when necessary.
* Resizing of scoring tasks improved.
* Confirmation added before resetting dashboard layout.
* Tooltip in time series charts now shows user-friendly field names.
* Power Search now allows reordering of fields.

***

### Fixes

#### Reports & Dashboards

* Bar and column charts now support hidden columns.
* Dynamic fields in reports now support conditional functions.
* Table download button exports all configured rows correctly.
* Y-axis title in scatter plots displays properly.
* Custom "no data" message now appears as expected.
* "Show table" toggle now works correctly.

#### Forms & Parameters

* Dynamic parameters now function properly in forms.
* Checkbox fields no longer default to button style (manual toggle required).
* Filters with null values no longer freeze the screen.
* "Clear filters" now resets date ranges.
* Date ranges used as filters now apply correctly.
* Filters in forms are now saved at the top of the table.
* Form Card color button responds to updates.
* Required fields now block submission if left empty.

#### SQL, External SQL & Tables

* Frequency errors in studio tables resolved.
* External SQL now preserves selected database, label, and executes properly.
* SQL column splitting in result views now behaves correctly.

#### Builder, Studio & Projects

* Joins between different bucket tables now supported.
* Layout fixes for InsertTable, TaskInsertRow, and TaskUpload components.
* Right-click in Canvas now allows proper table switching.

#### Python / REST / AutoML

* REST task auto-configuration returns data correctly.
* AutoML recreates variable table after model updates.
* AutoML correctly displays saved model information.

#### General / System

* AI execution now continues after error with improved handling.
* Temporary and AI tables are no longer publicly listed.


# 2026


# Changelog

### v.26.06.01

#### Monitor

* Added a date range filter to query executions and monitor events.

#### Reports

* Added support for bold formatting in report headers.

#### Canvas

* Added a context menu option using right-click on functionalities and tables.

***

### Improvements

#### Dashboard

* Improved responsive grid behavior to automatically adapt to different screen resolutions.

#### Monitor

* Removed log retention limitations, allowing extended execution history for auditing and analysis.

#### Pivot

* Updated save behavior to automatically execute the task after saving, eliminating the need for manual execution.

#### Content

* Improved navigation and rendering behavior by removing horizontal and vertical scrolling limitations.

***

### Fixes

#### AI Dashboard

* Fixed an issue preventing Data Chat from generating AI-powered dashboards.

#### Content

* Fixed an issue causing code rollback after saving and reopening dashboards, which restored previous script versions.

#### REST

* Fixed an issue that prevented execution logs from being generated in REST tasks.

#### Logs

* Fixed the storage of platform execution logs.

#### Data Insertion

* Fixed a column mismatch error during insert operations when the previous table structure contained a different number of columns.
* Fixed automatic metadata updates when column structures change, eliminating the need to recreate tasks.
* Fixed an issue in scheduled data insertion routines that prevented data from being properly written.

#### Migration

* Fixed the import behavior of applications migrated from the previous version, removing unintended references to legacy buckets.

#### Files

* Fixed the incorrect object being sent when applying filters to files.

#### Monitor

* Fixed a rendering issue when filtering errors in the scheduling view.

#### MySQL

* Fixed an error occurring during imports into MySQL connections.

### v26.04.28

***

### New Features

#### Authentication & Access

* Single Sign-On (SSO) configuration available for external identity providers
* Login via Google account
* Login via Microsoft account
* Two-Factor Authentication (2FA) configuration
* 2FA support for developer and admin users

#### AI & Agents

* AI Helper available across the platform
* AI Helper support in calculated fields
* Scroll support in Agent interfaces for long outputs
* Agent task renamed (Analytics): “Chat Agent” → “Agent”
* Automatic Dashboard creation via AI (improved flow and naming)

#### Data Ingestion & Files

* JSON / Parquet → Table task
* Automatic file ingestion (Upload / SFTP)
* File metadata preview before ingestion
* Destination selection for imported files
* CSV Input aligned with Quick Upload behavior

#### Studio & Flow

* Bulk move and copy of items in Studio
* Folder support for flows/processes
* Cross-dashboard movement of tables and queries (preserving references)
* Improved organization of generated elements

#### Reports & Charts

* Category-based colors for all major chart types
* Background color configuration
* Independent legend ordering
* Axis scale configuration
* Gauge chart color segmentation (static and column-based)
* Watermark support in charts
* Total display for donut charts
* Totals in report tables
* Parameter support in titles
* Render string support (titles and descriptions)
* Fullscreen dashboards

#### Builder

* AI Helper in calculated fields
* Code formatting for calculated expressions
* Column type visualization in preview
* Decimal precision configuration
* Date/Datetime aggregation support
* Cross-bucket joins
* Parameter access in Python tasks

#### API & REST

* POST requests with JSON payload
* Batch data sending in REST tasks
* Execution abort support
* Administrative SQL commands (e.g. SHOW CREATE TABLE)
* External SQL tasks without mandatory table creation

#### Sources & Connections

* Refresh connection action
* SQL Server schema selector
* Legacy SQL Server connection support
* Snowflake test database
* Improved Oracle handling for large datasets

#### Maps

* Global vs app-level map availability
* Map links to trigger processes
* Parameter-to-column mapping
* Bucket origin visibility
* Improved map editor workflow

#### White Label

* White Label configuration
* Custom browser tab title

#### Apps & Portal

* Automatic personal app creation for new users
* “Tips” app with tutorial content
* Portal access and user management improvements

***

### Improvements

#### AI & Dashboards

* Dashboard creation flow with clearer guidance
* Stability when adding AI-generated charts
* Table switching behavior inside AI dashboards
* Navigation and chart pinning consistency

#### Reports

* Chart updates without full re-render
* Tooltip formatting aligned with data labels
* Labeling, legend, and axis consistency
* Handling of hidden dimensions
* Performance across chart types
* Table pagination and sorting
* Date/time ordering behavior
* Improved responsiveness

#### Builder & Query

* Parameter handling in calculated fields
* Date/datetime filtering logic
* AND/OR logic evaluation
* Column alias consistency
* Query structure handling
* Column organization

#### Files & CSV

* Large file upload performance
* Null handling in type conversion
* Import as string option
* Lowercase column naming option
* Compatibility with legacy exports
* Wide-table rendering

#### Studio & UI

* Sidebar usability
* Drag-and-drop interactions
* Icon standardization
* Empty states across modules
* Modal and window focus behavior
* Table refresh interaction
* Selection and zoom behavior

#### Settings & Users

* User creation and group assignment
* Password visibility during creation
* API key persistence
* API key visibility
* Version information display

***

### Fixes

#### Authentication

* Language reset after login
* Invalid API token handling
* Dashboard permission recognition
* Duplicate users after recreation

#### AI & Agents

* Context switching issues
* Duplicate chat rendering
* Dashboard navigation inconsistencies
* Chart insertion errors

#### API & REST

* Missing process key in configuration
* API key status persistence
* API key visibility after creation
* REST task naming issues
* POST body availability
* Execution timing in chained requests

#### Builder

* Parameter usage in calculated fields
* Dependency recalculation
* Table loading inconsistencies
* Date vs datetime filter mismatch
* Column deletion side effects
* Preview inconsistencies

#### Reports & Dashboards

* Filter application failures
* Table pagination issues
* Broken chart links
* Tooltip ordering
* Scatter plot color mismatch
* Radar rendering
* Stacked chart axis conflicts
* Label overlap
* Empty state handling

#### Data Processing & Models

* Association Rules execution
* PCA execution
* Clustering execution
* Decimal parameter validation
* AutoML regeneration issues
* Model state persistence

#### Files & Export

* Empty CSV generation
* Export inconsistencies
* Multiple file upload issues
* File deletion cancellation behavior
* Output UI inconsistencies

#### Studio & Flow

* Task disappearance/misconfiguration
* Flow organization issues
* Persistence problems after navigation
* Incorrect task opening
* Rollback inconsistencies

## V0.0.1319

***

## AI & Chat

### Fixes

* Fixed issue where users were unable to generate **AI dashboards** even when having the correct table permissions configured.

***

## Reports

### Fixes

* Fixed issue where **report parameters inside report tasks were not captured correctly**.
* Fixed issue where **decimal masking applied to float values was not reflected correctly in reports**.

***

## Builder&#x20;

### Fixes

* Fixed incorrect **aggregation error messages shown in preview mode**.
* Fixed issue where **ORDER BY was not properly applied in Builder preview queries**.

***

## Studio

### Fixes

* Fixed issue where **temporary tables (tmp\_) sometimes received an incorrect user context ID**, causing execution errors.
* Fixed issue where **session-scoped temporary tables were not properly recognized inside Python or query contexts**.

***

## Python Tasks

### Fixes

* Fixed bug where typing **`params` inside the Python editor triggered unintended replacements**.
* Fixed issue where **temporary tables within session context were not resolved correctly in Python tasks**.

***

## Content

### Fixes

* Fixed missing **row limiter functionality** inside the Content module.

***

## REST

### Fixes

* Fixed behavior where **REST tasks were executing before data insertion completed**, causing inconsistent results.

***

## Integrations

### Fixes

* Fixed issue where **CSV imports used incorrect bucket references**.

***

## Storage

### Fixes

* Fixed limitation preventing **CSV uploads larger than 1.5GB**.
* Fixed **MinIO timeout errors** affecting existing storage connections.

### Improvements

* Improved **MinIO connection stability**, reducing intermittent storage failures.

***

## Flows

### Fixes

* Fixed issue where **Run Flow action was not executing flows correctly**.
* Fixed issue where **background flows triggered via Portal filters were not executed properly**.

***

## Tables

### Fixes

* Fixed issue where **functions such as `generateUUIDv4()` were inserted as literal strings during table creation instead of being executed**.

***

## Export / Import

### Fixes

* Fixed inconsistencies in **Gaio Export (OLD → New Gaio)** process.
* Fixed issue preventing **project exports from including folder structures correctly**.

### Improvements

* Improved **project export functionality**, ensuring folder hierarchy is preserved during export.

***

## V0.0.1290

***

### Gaio Export OLD / New Gaio

#### Fixes

* **Forms**&#x20;
  * Resolved issue where Forms module was not correctly recognizing table metadata and associated data.
* **Content**&#x20;
  * Fixed failure in Content module where scripts were not being properly retrieved or rendered.
* **Forecast**&#x20;
  * Corrected issue in Forecast module where recognition/processing logic was failing.

#### Improvements

* **REST**
  * Adjusted REST task behavior where tasks were successfully created but not executed.
  * Improved execution pipeline to ensure proper trigger after task instantiation.

***

### Settings: Authentication provider (SSO)

#### New Features

* **Add 2FA configuration**
  * Implemented Two-Factor Authentication (2FA) configuration within authentication provider settings for users.
  * Enhances platform security and access control.
* **Third-party providers**
  * Connection with Microsoft Sign In ID.

## V0.0.1269

***

### AI & Chat

#### New Features

* Implemented response streaming in AI Chat, allowing users to view answers as they are generated in real time.

#### Improvements

* UI/UX enhancements in AI Chat, improving layout, readability, and interaction flow.
* Performance optimizations for rendering long AI-generated responses.

#### Fixes

* Fixed visual issues during intermediate loading states in the chat.
* Resolved inconsistencies in the display of AI-generated responses.

***

### Reports & Dashboards (Studio)

#### Improvements

* Enhanced the experience when opening existing reports in Studio.
* Improved rendering of composite charts (line and column).
* Standardized tooltip formatting across charts.
* Added support for independent legend ordering, separate from column sorting.
* General stability improvements in report creation and editing.

#### Fixes

* Fixed an issue where previously created tables appeared empty when opening reports.
* Resolved duplicated labels in charts with multiple axes.
* Fixed missing legends when hidden dimensions were used.
* Corrected visual inconsistencies across dashboards.

***

### White Label & Customization

#### New Features

* Introduced **White Label Settings** for environment customization.
* Added support for customizing the browser tab title in White Label environments.

#### Improvements

* Improved persistence and consistency of White Label configuration settings.
* Enhanced the customization architecture for branded environments.

***

### Power Search & Navigation

#### Fixes

* Fixed an issue where Power Search incorrectly retained the last search state.
* Improved filter and search history reset behavior across sessions.

***

### Infrastructure & Core Services

#### Improvements

* Improved infrastructure stability and internal support processes.
* Performance optimizations across core services.

#### Fixes

* Fixed issues related to database connectivity.
* Resolved operational errors identified in production.
* Corrected issues related to customer data migration processes.

***

### General Stability

#### Improvements

* Incremental performance improvements in critical platform components.

#### Fixes

* General bug fixes based on support feedback.
* Improved consistency across creation, editing, and visualization workflows.


# Tell me

{% embed url="<https://gaio-doc-agent.vercel.app/>" %}